SerDes Analysis
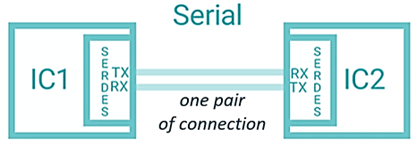
SerDes stands for Serializer/Deserializer, which is a technology used for converting parallel data into a serial stream and vice versa.
Features and Menu Description
Through the SerDes simulation feature, users can evaluate the electrical performance and reliability in specific applications. By simulating the operation of SerDes under various operating conditions, engineers can optimize their designs and minimize issues such as signal degradation, jitter, noise, and crosstalk, ensuring that the transmitted data arrives at its destination accurately from the signal integrity perspective.
The Network Analysis dialog includes the Statistical Eye (Bathtub) option, indicated by the red box in the image below. This option enables users to perform statistical eye analysis and bathtub analysis when importing an IBIS-AMI model for SerDes analysis. The IBIS-AMI model can be added from the menu bar, click menu.
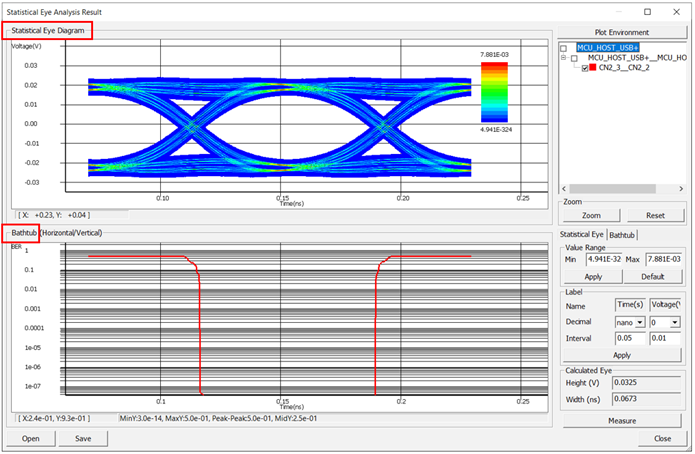
The figure below shows an example of the Statistical Eye diagram and Bathtub result. In the resulting dialog, the upper section displays the Statistical Eye diagram, while the lower section shows the Bathtub results (Horizontal or Vertical), all within a single dialog which is the Statistical Eye Analysis Result.
The SerDes function enables simulations for both differential pair nets or single nets differential pair nets or single nets, providing the flexibility to perform testing on multi-nets as well. This has 8 kinds of Statistical Eye Analysis parameters available and users can modify each parameter to simulate different scenarios.
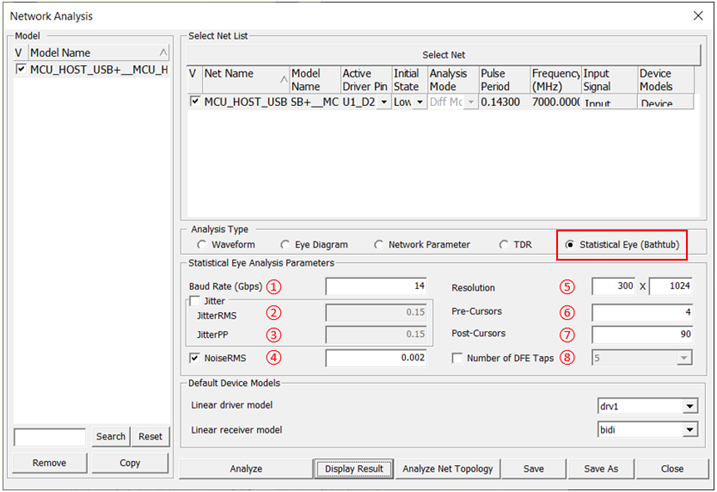
- BaudRate (Gbps): the number of symbols per second, which means the data rate of the signal line for the statistical eye analysis.
- JitterRMS: the RMS value of jitter in UIrms, related to Random Jitter(RJ) rms value.
- JitterPP: the full range of the jitter distribution in UIpp, related to Deterministic Jitter(DJ) Peak to Peak value.
- NoiseRMS: the RMS value of noise in UIrms.
-
Resolution: SamplePerSymbol, related to X-axis of the statistical eye diagram.
SamplePerVoltage, related to Y-axis of the statistical eye diagram.
- Pre-Cursors: the number of cursors that occurs before the occurrence of the main signal.
- Post-cursors: the number of cursors that occurs after the occurrence of the main signal.
- Number of DFE Taps: DFE tap filter's amount.
The SerDes function has the capability to simulate various types of SerDes input modulations, such as NRZ and PAM4 data transmission. The distinction between these modulations lies in the number of voltage levels employed to represent the data. Each modulation technology offers different analyses in terms of bandwidth efficiency, noise sensitivity, and equalization requirements.
Through the Input signal menu, users can set up an NRZ input and PAM4 input respectively as mentioned below:
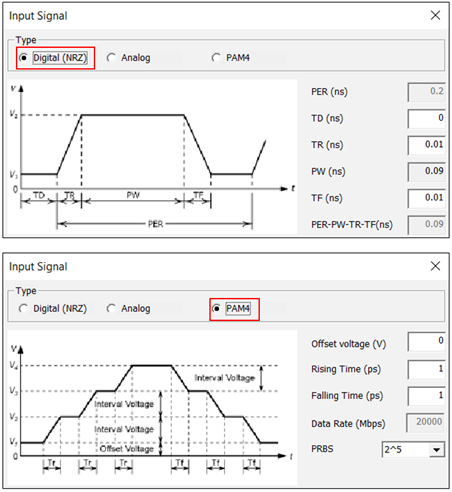
- NRZ (Non-Return to Zero) is a digital modulation technique used in data transmission where a constant voltage level is maintained throughout the duration of a bit. In NRZ, a logic "0" is represented by a low voltage level, while a logic "1" is represented by a high voltage level.
- PAM4 (Pulse Amplitude Modulation with 4 levels) is a more advanced digital modulation technique used in high-speed data transmission. PAM4 utilizes four distinct voltage levels to represent different combinations of binary digits. These voltage levels can represent binary sequences such as "00," "01," "10," and "11". By using four levels instead of two, PAM4 can transmit more data per symbol, significantly increasing the bandwidth efficiency compared to NRZ.
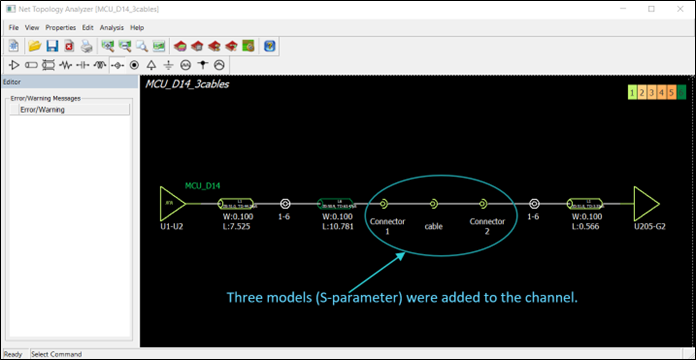
And S-parameter models of cables and connectors can be inserted between the TX and RX for SerDes simulations. In the Net topology Analyzer dialog, if the user adds S-parameters as shown in the diagram below, it is possible to evaluate the statistical eye and bathtub considering the losses caused by cables and connectors in the channel.
Statistical Eye Analysis
A statistical eye diagram is a tool used in signal integrity analysis to assess the quality and reliability of a digital communication signal. It provides a visual representation of the signal's voltage levels and timing margins, allowing engineers to evaluate the signal's performance in the presence of noise, jitter, and other distortion.
The following is an example of a statistical Eye Diagram obtained through the SerDes function of a specific differential line. The statistical Eye Diagram is located at the top of the Statistical Eye Analysis Result dialogue and is marked with a purple box below.
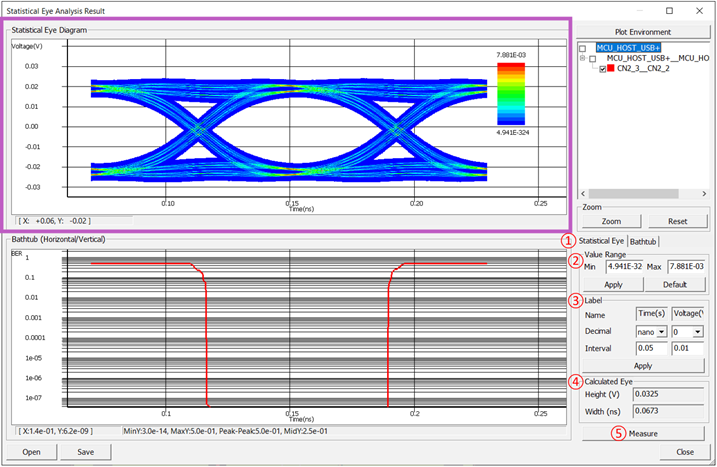
- Result tabs: The Statistical Eye Analysis Result dialogue is divided into two tabs, namely Statistical Eye and Bathtub Curve.
- Value Range: It allows adjusting the minimum and maximum values of the color spectrum of the Statistical Eye.
- Label: It controls the X-axis and Y-axis of the Statistical Eye.
- Calculated Eye: These are the automatically calculated values of the eye width and eye height using the Statistical algorithm.
- Measure: It allows manually measuring the values of the Statistical Eye.
Bathtub Curve Analysis
Bathtub curves (also referred to as “BERT scans”) are typically constructed using bit error ratio testers (BERT). A BERT produces data that is sent through a device under test (DUT) and then examines the transmitted data, comparing it to the original, in order to determine the bit error ratio (BER). The bathtub curve concept can be used on a signal integrity basis, and it can be useful in understanding the reliability aspects of electronic systems over time. By analyzing failure rates and failure modes, engineers can design systems that minimize the occurrence of failures and ensure optimal signal integrity throughout the operational life of the product.
The following is an example of a Bathtub Curve obtained through the SerDes function of a specific differential line. The Bathtub Curve is located at the bottom of the Statistical Eye Analysis Result dialogue and is marked with a purple box below.
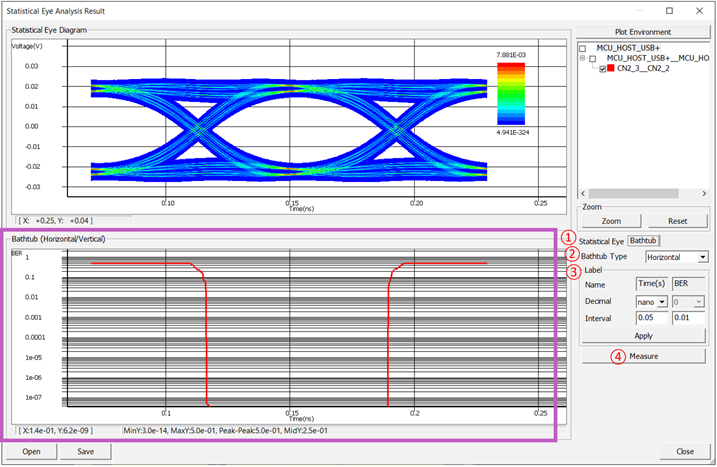
- Result tabs: The Statistical Eye Analysis Result dialogue is divided into two tabs, namely Statistical Eye and Bathtub Curve.
- Bathtub Type: There are two types. In the vertical type, the X-axis represents time, while in the horizontal type, the X-axis represents voltage. In the vertical type, the timing margin can be measured, while in the horizontal type, the voltage margin can be measured.
- Label: It controls the X-axis and Y-axis of the Statistical Eye.
- Measure: It allows manually measuring the values of the Statistical Eye.
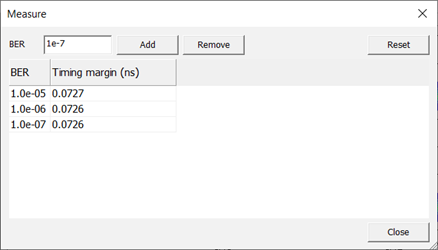
Users can measure the timing margin or voltage margin by pressing the Measure button at the desired Bit Error Rate (BER). Below are example results of timing margin measured at three different BERs (1.0e-05, 1.0e-06, and 1.0e-07).