
Tutorial: Strain Energy Density Analysis
Tutorial Level: Beginner Run a normal modes analysis and examine the strain energy density results.
In this lesson, you will:
- Run a normal modes analysis on a simple bracket supporting a mass
- Examine the strain energy density results
- Change the design of the bracket (without adding any mass) based on these results
- Compare the designs
The purpose of the tutorial is to demonstrate the following principles:
- When a structure deforms, different regions strain by different amounts. The sum of the energy in the structure due to the deformation is called the strain energy.
- Eigenvalues are normalized when a modal analysis is performed. The strain energy density results are used to determine which areas of the structure are under the greatest strain and contribute most to the stiffness.
- Targeting areas of high strain energy density for design changes is a common method to increase the natural frequencies in a modal analysis.
Examine the Model and Run a Modal Analysis
-
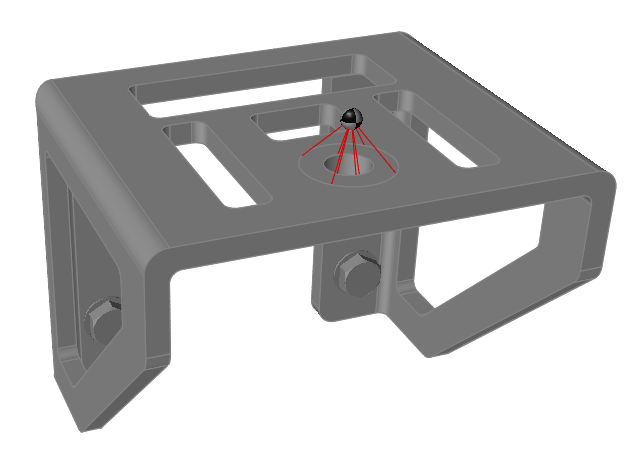
Double-click the 0.0_SED_tutorial.stmod file to load it in
the modeling window. Note that the model has a concentrated mass and four
grounded bolts in a load case.
- Make sure the display units in the Unit System Selector are set to MMKS (mm kg N s).
-
Create a modal load case:
-
On the Structure ribbon, click the Modal
button.

-
Click the Supports collector and select the four
grounded bolts.

- Change the number of Modes to 3.
- Click OK.
-
On the Structure ribbon, click the Modal
button.
-
On the Structure ribbon, click the
Run Analysis
 button in the
Analyze tool group.
button in the
Analyze tool group.
-
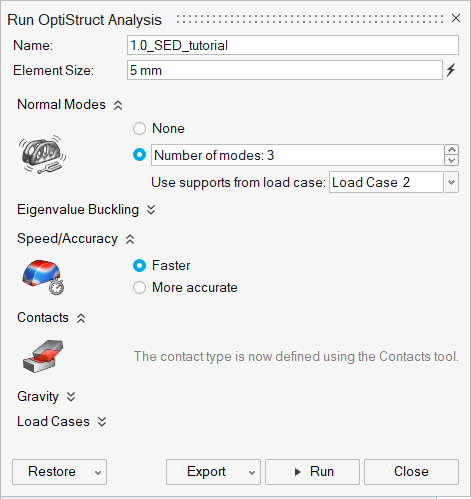
Run a Normal Modes analysis using the following settings:
-
Click Run to perform the analysis.
-
Click Run to perform the analysis.
Review the Strain Energy Density Results
-
When the analysis is complete, select it in the Run Status window and click
View Now to view the results.

Tip: You can also double-click the Results icon in the Model Browser to view results for a load case.
-
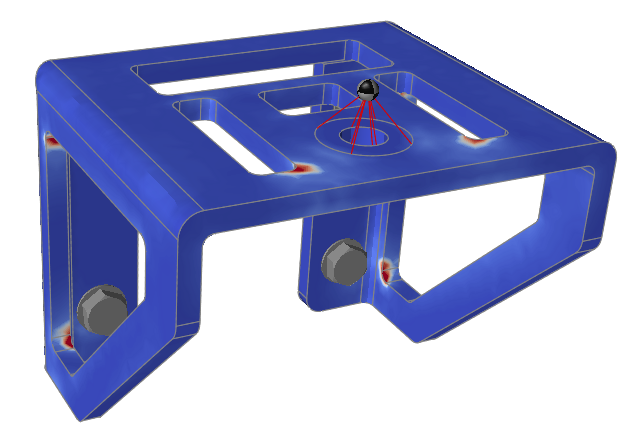
Click the
 button on the animation
toolbar to visualize the displacement. Click the
button on the animation
toolbar to visualize the displacement. Click the  button to pause the
animation. Note that although the mode shape is clear, it is difficult to know
which parts of the structure are most critical.
button to pause the
animation. Note that although the mode shape is clear, it is difficult to know
which parts of the structure are most critical.
-
Adjust the Analysis Explorer using the following settings:
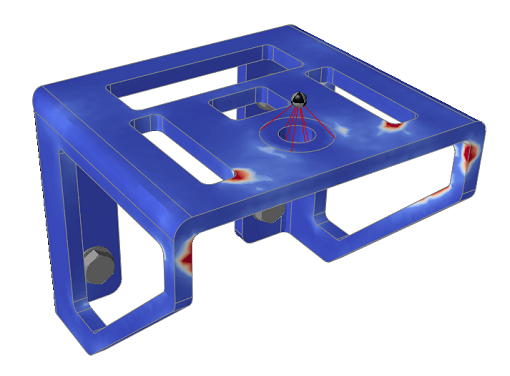
- Select Strain Energy Density under Result.
- Double-click the legend maximum and change it to 50 J/mm3.
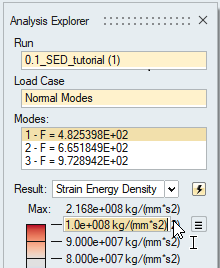
This highlights the areas of the structure with the highest relative strain. Adding material to these high strain regions is normally a good way to increase the natural frequency.
Add Material to the High Strain Regions
-
On the Geometry ribbon, select the Move Faces
tool.

Note: To find and open a tool, press Ctrl+F. For more information, see Find and Search for Tools. -
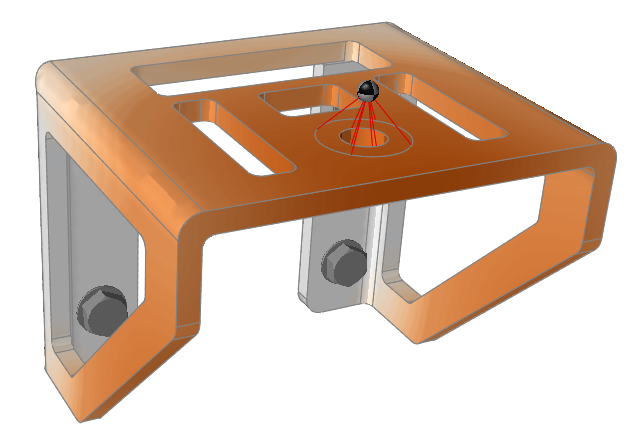
Click each face of the large side cutouts with the Move
Faces tool to select them.
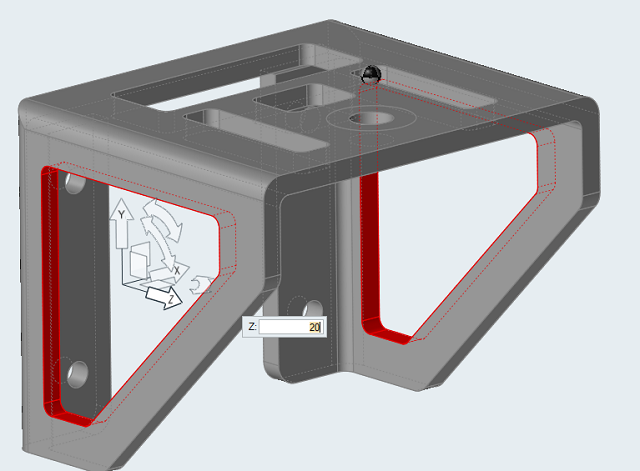
-
Click the Z Translation arrow and type 20
mm in the box to move the cutouts in the Z direction.

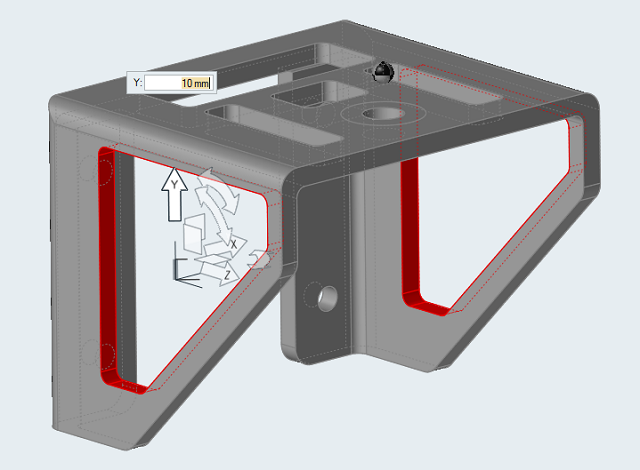
-
Click the Y Translation arrow and type 10
mm to move the cutouts in the Y direction. This adds material to
the area of high strain energy density without changing the mass of the
design.
-
On the Structure ribbon, click the
Run Analysis
button in the
Analyze tool group to run the analysis again.

In the Analysis Explorer, note that the first frequency has increased from 372 Hz to 388 Hz.
- In the Analysis Explorer, click Compare Results.
-
Right-click the top of the table and choose Normal Modes
to display the normal mode results.

Compare Results is a powerful tool to track analysis results and design performance
against model changes.

In summary, targeting areas of high strain energy density is a powerful approach for increasing the stiffness of structures. In this tutorial, the first mode was increased significantly with no material added.