Tutorial Level: Beginner Create callouts and compare multiple analysis and optimization results.
In this lesson you will learn how to:
Create callouts for analysis results
Compare analysis results
Compare optimization results
Change the result type being compared
Show callouts in the comparison table
Sort and add columns to the comparison table
Overview
When performing optimization or finite element analysis, it is typical to generate
many different models and results, each with slight variations. The Compare Results
feature allows you to easily display and compare analysis or optimization runs in a
table format. All of the results that have been generated or loaded into Inspire during the current session can be compared. When
combined with callouts, this allows for detailed interrogation of analysis
results.
Some typical use cases include:
Performing an analysis with multiple load cases. For example, the maximum
stress results across all load cases can be compared in a single table.
Comparing optimization runs generated from variations in shape controls and
minimum thickness. The resulting mass estimates and parameters used in each
run are summarized, allowing you to assess performance against cost and
complexity.
Running a single model with an increasingly small element size and comparing
the results to ensure convergence.
Open a Model and View Analysis Results
Let's start by opening a model with analysis results and
comparing those results using the Analysis Explorer.
Press F7 to open the Demo Browser.
Double-click the Compare_Analysis_Results.stmod file to
load it in the modeling window.
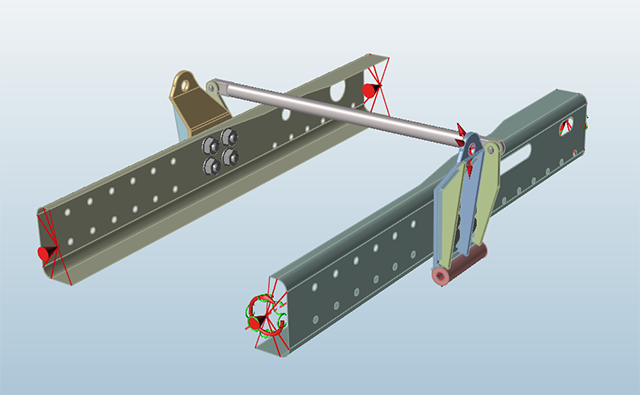
This model has several surface and solid parts with five different load
cases.
Make sure the display units in the Unit System Selector are set to
MPA (mm t N s).
On the Structure ribbon, click the Show Analysis Results
button in the Analyze tool group.
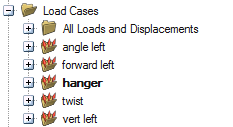
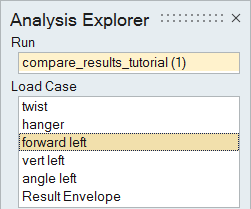
Note that in the Analysis Explorer, all five load cases are shown and
have seven different result types associated with each.
In the Analysis Explorer, select Factor of Safety from
the Result Types and click through each of the load
cases.
Tip: It is difficult
to compare the results for each load case without writing down the minimum
result for each.
Compare Analysis Results
Next, let's compare results using the comparison
table.
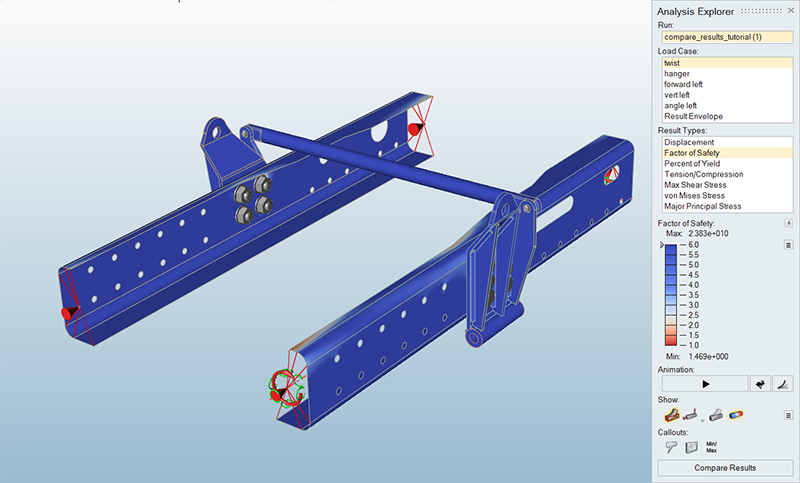
In the Analysis Explorer, select the button under Callouts.
This adds callouts where the minimum and maximum factors of safety
occur.
Click the Compare Results button in the Analysis
Explorer.
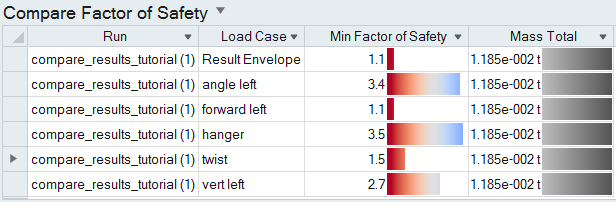
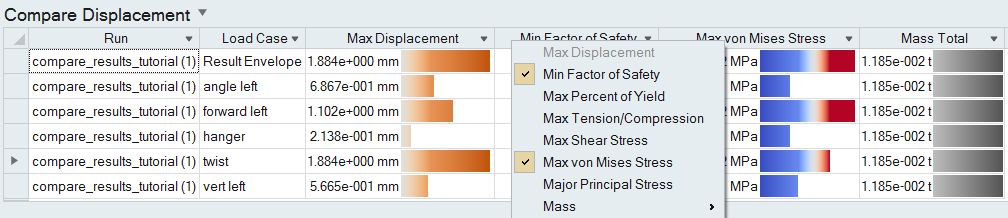
A table comparing the minimum factor of safety across all load cases is
displayed below the modeling window.
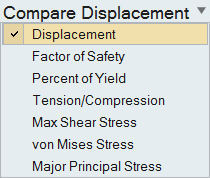
Click the table title and select Displacement to change
what type of results are compared.
Right-click on a column header in the comparison table and select additional
result types and parameters to display as columns.
Click the table title and select Factor of Safety.
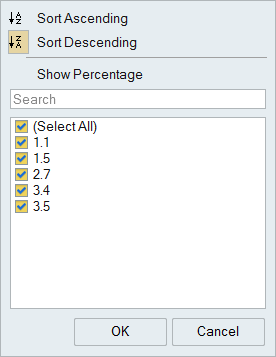
Click the Min Factor of Safety column header to sort the
analysis runs by that result.
Repeated clicks will toggle the sort order between ascending and
descending.
After sorting, an arrow appears in the column header indicating whether the
column is sorted in ascending or descending order. Click the arrow to open a
window that allows you to select which runs and load cases to display and to
filter the results.
Add Callouts to the Model
Sometimes it is useful to understand the response at a
specific location across all load cases. This can be done using callouts.
In the Analysis Explorer, select forward left from the
Load Case dropdown.
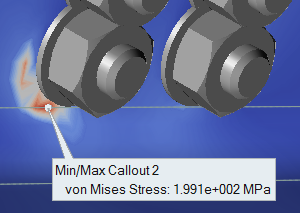
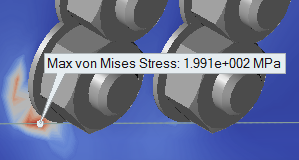
Select von Mises Stress from the Result
Types dropdown and identify the area with the maximum von Mises
stress.
In the Analysis Explorer, click the Create, Hide, and Show
Callouts icon under Callouts.
Click the Max von Mises Stress callout in the modeling
window to create a standard callout in the same location.
Click the icon under Callouts to turn
off the min/max callouts.
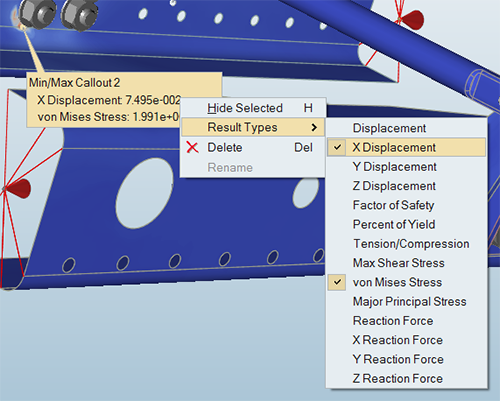
Right-click the callout and select Result Types > Displacement > X from the context menu.
From here, you can select additional result types and other derived results
such as reaction forces that you want to display at the callout location.
Callouts can also be shown in the comparison table.
Right-click on a column header in the table and select Callouts > Max Callout 1 to add this as a column to the table.
Click the table title and select Max Callout 1
to compare different result types at the callout location.
Note: Contents of cells in the table can be highlighted and then copied and
pasted using Ctrl+C and
Ctrl+V.
Compare Optimization Results
Next, we'll use the comparison table to compare
optimization results.
Double-click the Compare_Optimization.stmod file in the
Demo Browser to load it in the modeling window.
This model has three load cases, with two sets of optimization results and two
sets of reanalysis results.
On the Structure ribbon, click the Show Optimization
Results button in the Analyze tool
group.
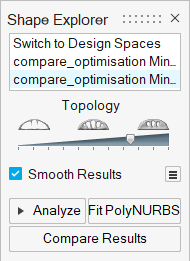
Note that in the Shape Explorer, there are two different optimization results
with very different topology.
Click the Compare Results button on the Shape
Explorer.
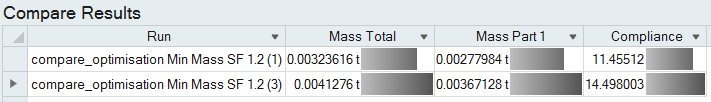
A table comparing the optimized mass and compliance for each run is
displayed.
Right-click one of the column headers in the table and select
Symmetry Controls. Next, under
Optimization Settings, select Load
Cases, Objective, and
Thickness (Min) to add these columns to the
table.
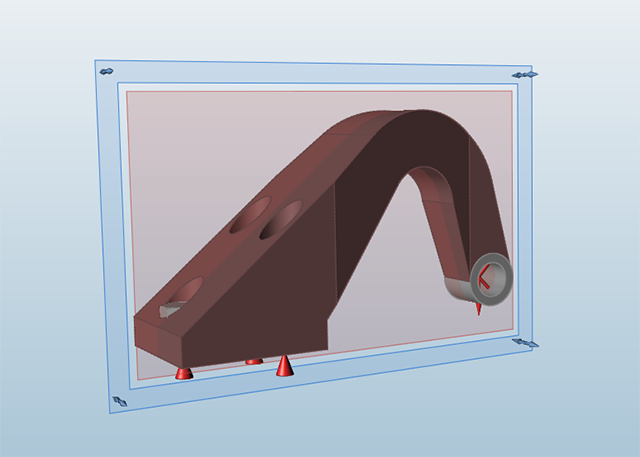
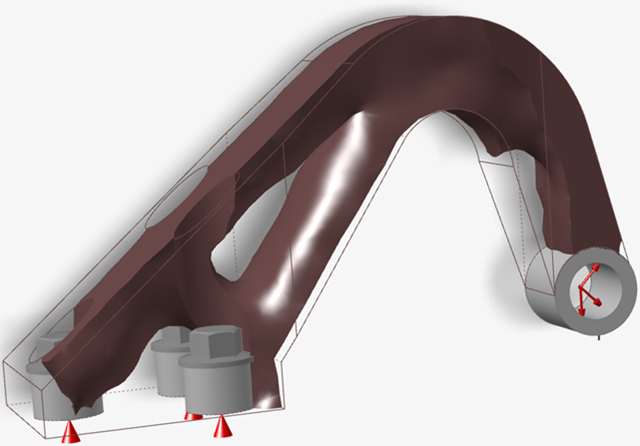
Double-click on the run name in the first row, and then the second row.
Note how the optimized shape shown in the modeling window is updated based on
which run is selected in the table.Figure 1. First Run
Figure 2. Second Run
Note: Note that the second run has a split draw shape control and twice
the minimum thickness of the first run. Also, the mass of the optimized
shape for the first run is lower than for the second run. This is expected,
as with fewer constraints on the design, a more optimum shape is obtained.
The first run would likely be more complex to manufacture using traditional
methods, increasing the costs. Summarizing these results in table form can
greatly aid assessing design concepts.
Compare Reanalysis Results
Now we'll go back and compare the reanalysis results,
which were created by clicking the Analyze button on the Shape
Explorer for each optimization result.
On the Structure ribbon, click the Show Analysis Results
button in the Analyze tool group.
Click the Compare Results button on the Analysis
Explorer.
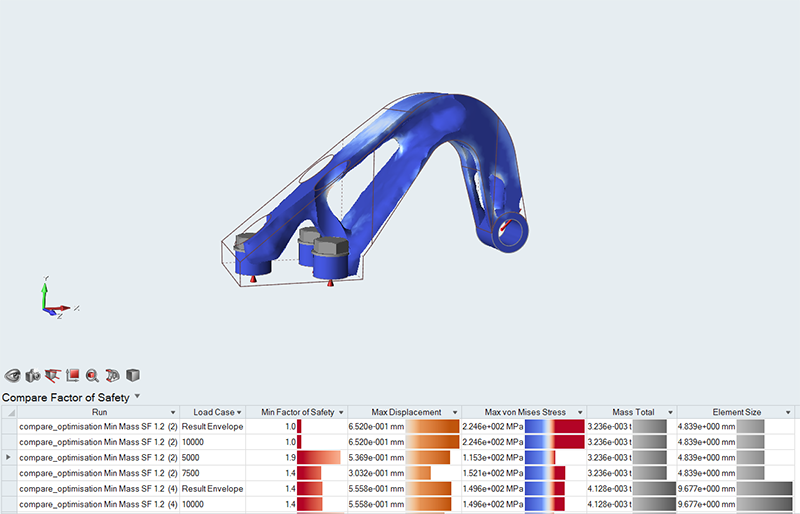
A table comparing the total mass for each run and load case is displayed
below the modeling window.
Right-click one of the column headers in the table and select Factor of Safety > Min.
Right-click one of the column headers in the table and select Displacement > Max, von Mises Stress > Max, and Analysis Settings > Element Size to add these columns to the table.
Being able to quickly and easily compare the performance
of many concepts at an early stage allows the best design features and potential problem
areas to be identified, and is an essential part of the design process.


 button under Callouts.
This adds callouts where the minimum and maximum factors of safety occur.
button under Callouts.
This adds callouts where the minimum and maximum factors of safety occur.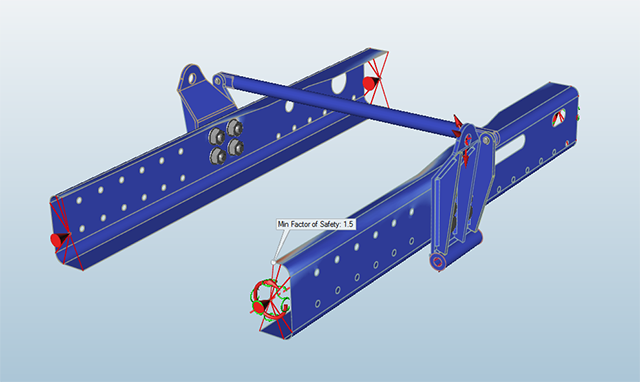
 icon under Callouts.