Expert AI
Use the standalone version of Expert AI for HyperStudy models and results.
The Expert AI Browser is divided into four areas: Extract from, Dataset, Classifiers,
and Constraints.
- Extract from
- Define the source of the files.
- Dataset
- Create datasets based on response type, like displacement. Review and visualize clustered results.
- Classifiers
- Generate classifiers from labeled cluster data. A trained classifier can be leveraged as a constraint in a subsequent optimization.
- Constraints
- Create and evaluate an optimization using a constraint created based on selected clusters.
-
From the Design Explorer ribbon, click the Expert AI
tool.
Figure 1. 
The Expert AI Browser opens. - Specify if you want to extract from a HyperStudy file or a results folder.
-
For Path, click
 and browse and select the required
files.
and browse and select the required
files.
-
Click
 to create a new dataset.
- In the Dataset dialog, select a Subcase.
-
Select one or more Result Types, a Step, and Part IDs of parts to be included
in the clustering.
Tip: Click
 to select parts from the HyperView
modeling window.Note:
to select parts from the HyperView
modeling window.Note:If no Steps are selected, then the final timestep will be used in the clustering.
If no PartIDs are selected, all parts will be used in the clustering. - Click Request.
-
Click Submit.
The clustering report is generated. Depending on the size of the model and results, the report may take some time to generate.
Once generated, the Dataset dialog will close, and the newly created cluster information will appear.
Figure 2. 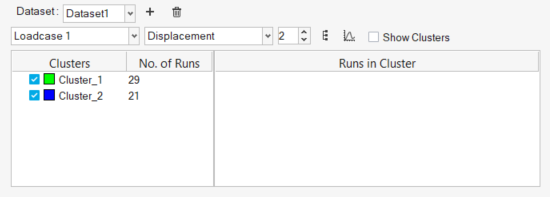
- Use the Visualize Clusters tools to interrogate clusters.
-
Click Train Classifier to create a classifier based on
the current clustering.
A trained classifier is listed, along with the following information shown in the table:
- Accuracy with Solver
- Indication of the expected accuracy when running a solver-based optimization.
- Accuracy with Fit
- Indication of the expected accuracy when running a fit-based optimization.
- R-Squared Fit
- Representation of the quality of the fit.
- Right-click the classifier and select Create Constraint.
-
Select a cluster to use as the constraint and enter a lower bound for the
constraint.
The subsequent optimization will attempt to satisfy the constraint such that the optimal result will conform to the selected cluster with probability greater than the constraint value.
- Click Optimize and choose the desired optimization type to run.
- In the HyperStudy Options dialog, select an objective for the optimization, and select the type or optimization to run (Fit-based or Solver-based).
- Click Run.
-
When the optimization is completed, click
 to open the Standalone Results Explorer
to review the results.
Note: From the Design Explorer ribbon, click the Results Explorer (EAI) tool to the open the Standalone Result Explorer. In the Path field, select the desired .hstudy file to open existing Standalone Expert AI optimization results.
to open the Standalone Results Explorer
to review the results.
Note: From the Design Explorer ribbon, click the Results Explorer (EAI) tool to the open the Standalone Result Explorer. In the Path field, select the desired .hstudy file to open existing Standalone Expert AI optimization results.Figure 3. 
Visualize Clusters
There are a number of tools and features to help with interrogation and visualization of cluster information.
-
Click
 to display the dendrogram for
a given clustering.
A dendrogram is a visual tool which shows the hierarchical relationship between clusters.Tip: Click Save to save an image of the dendrogram.
to display the dendrogram for
a given clustering.
A dendrogram is a visual tool which shows the hierarchical relationship between clusters.Tip: Click Save to save an image of the dendrogram. -
Click
 to display a silhouette plot
for a given clustering.
The silhouette plot provides an indication of the validity and consistency within the clustering and how well each run has been classified.
to display a silhouette plot
for a given clustering.
The silhouette plot provides an indication of the validity and consistency within the clustering and how well each run has been classified. - Select the Show Clusters check box to color the runs on an active scatter plot by cluster.
-
Right-click on a cluster and select Animate
Cluster.
This loads an animation in the active HyperView client (if the active client is not a HyperView client, a new one is opened), overlaying the final deformed shape of each run in the selected cluster. This can be useful for visualizing the deformed shape of the given cluster as a whole.
-
Right-click on a cluster or in the white space of the Clusters column and
select Animate all Clusters.
This creates a new page and loads an animation for each cluster in a new HyperView client, overlaying the final deformed shape of each run in each cluster. This can be useful for visualizing the deformed shape of each cluster as a whole and comparing one cluster to another.
-
Select a cluster in the Clusters column, and the runs comprising that cluster
are displayed in the Runs in Cluster column. Select one or more runs in the Runs
in Cluster column, right-click, and select Overlay
Selection.
This will load an animation in the active HyperView client (if the active client is not a HyperView client, a new one is opened), overlaying the results, including all timesteps, of each of the selected runs.