Adjust the legend range for the current active 3D view.
3D view data can be clamped between two values to help reveal changes in a
result that would be missed with the default range. The colouring of the result is changed
whereby blue corresponds to the minimum value and red to the maximum value.
On the 3D View
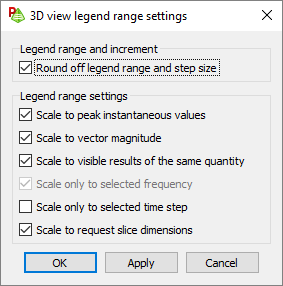
contextual tabs set, on the Display tab, in the
Legends group, click the dialog launcher.Figure 1. The 3D view legend range settings dialog.
The following settings are available:
Round off legend range and step size
Data is often represented in a decimal form to represent a value accurately. The
number of digits after the decimal point could result in a legend range that is
difficult to read and interpret.
Select this option for a more legible legend
containing rounded off values. The original data range is contained within the rounded
off range.
Scale to peak instantaneous values
This option is applicable when viewing the magnitude of a result along with the
instantaneous phase. The minimum and maximum value limits (and therefore the colours)
remain constant for each phase step. This option makes it simpler to see how the
magnitude changes over phase.
Clear the Scale to peak instantaneous
values check box when the magnitudes at the given phase are of interest
to synchronise the range limits with the displayed data.
Scale to vector magnitude
This option is applicable when comparing two components of a vector with one another.
It is simpler to compare relative magnitudes of the components if displayed relative to
the same maximum. Use this option to render the components relative to the total vector
magnitude. This option allows a relatively small component to be distinguished from a
larger component.
Scale to visible results of the same quantity
This option is applicable when a model contains several near field or far field
requests. Each request has its minimum and maximum value. For multiple results on a
view, POSTFEKO display the data relative to the minimum
and maximum found over all the results added to the view. Deselecting this option
renders each result according to its minimum, and maximum value.
Scale only to selected frequency
This option is only enabled when discrete frequency data is available in the model.
The range limits are determined by the minimum and maximum values found over all the
calculated frequency points. For example, it is more convenient to view the change in
far field gain over frequency when the far field is scaled according to the maximum /
minimum found over all calculated points.
Scale only to selected time step
This option is applicable for time domain analysis where the range limits are
determined by the minimum and maximum values of the displayed data for a selected time
signal sample.
Scale to request slice dimensions
This option is applicable when the range values are to be determined by the displayed
slice1.
Note: Each setting is applied independently, meaning that a wide variety of
combinations are possible to help display and interpret the data in the desired
manner.
1 For example, if you have a 3D near field result with data in the X axis, Y axis and Z axis, a
slice of data is a cut at a specific X value and Y value.
 dialog launcher.