Viewing the Prediction Results in 2D
Display the power prediction results in 2D using the multi-wall model (COST 231).
-
In the tree, expand Results: Propagation and click
Power.
Figure 1. The tree in ProMan showing the results. 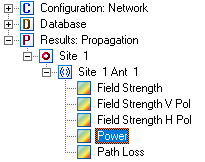
-
View the power prediction results in the 2D view.
Note: Expect the results to take a minute or so to load.
Figure 2. Prediction of received power, by a hypothetical isotropic antenna, using the multi-wall model (COST 231). 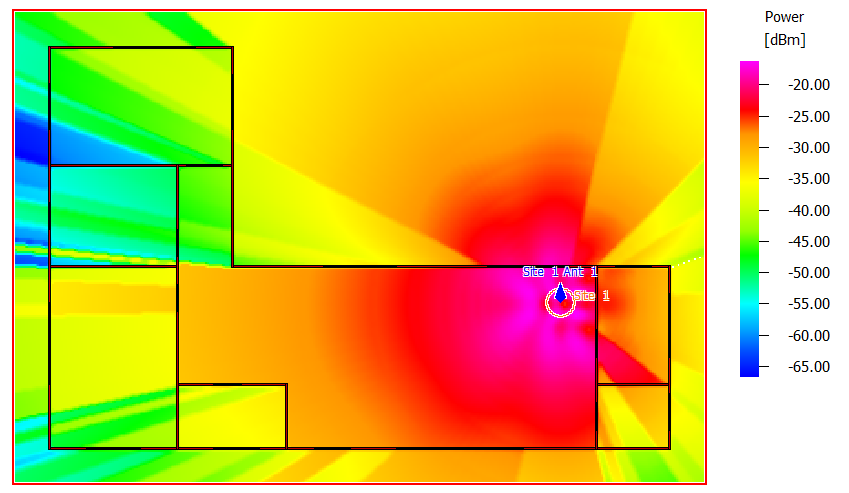
Note:
- Rays from the Wi-Fi router are straight.
- Distance and number of walls determine the field strength.