NavOps Home
The NavOps Home page provides a dashboard to quickly view the current status and navigate to the main pages of the application.
- NavOps Menu
- Cloud and Automations Panel
- Clusters List
- Recent Activities
- Burn Rate Chart
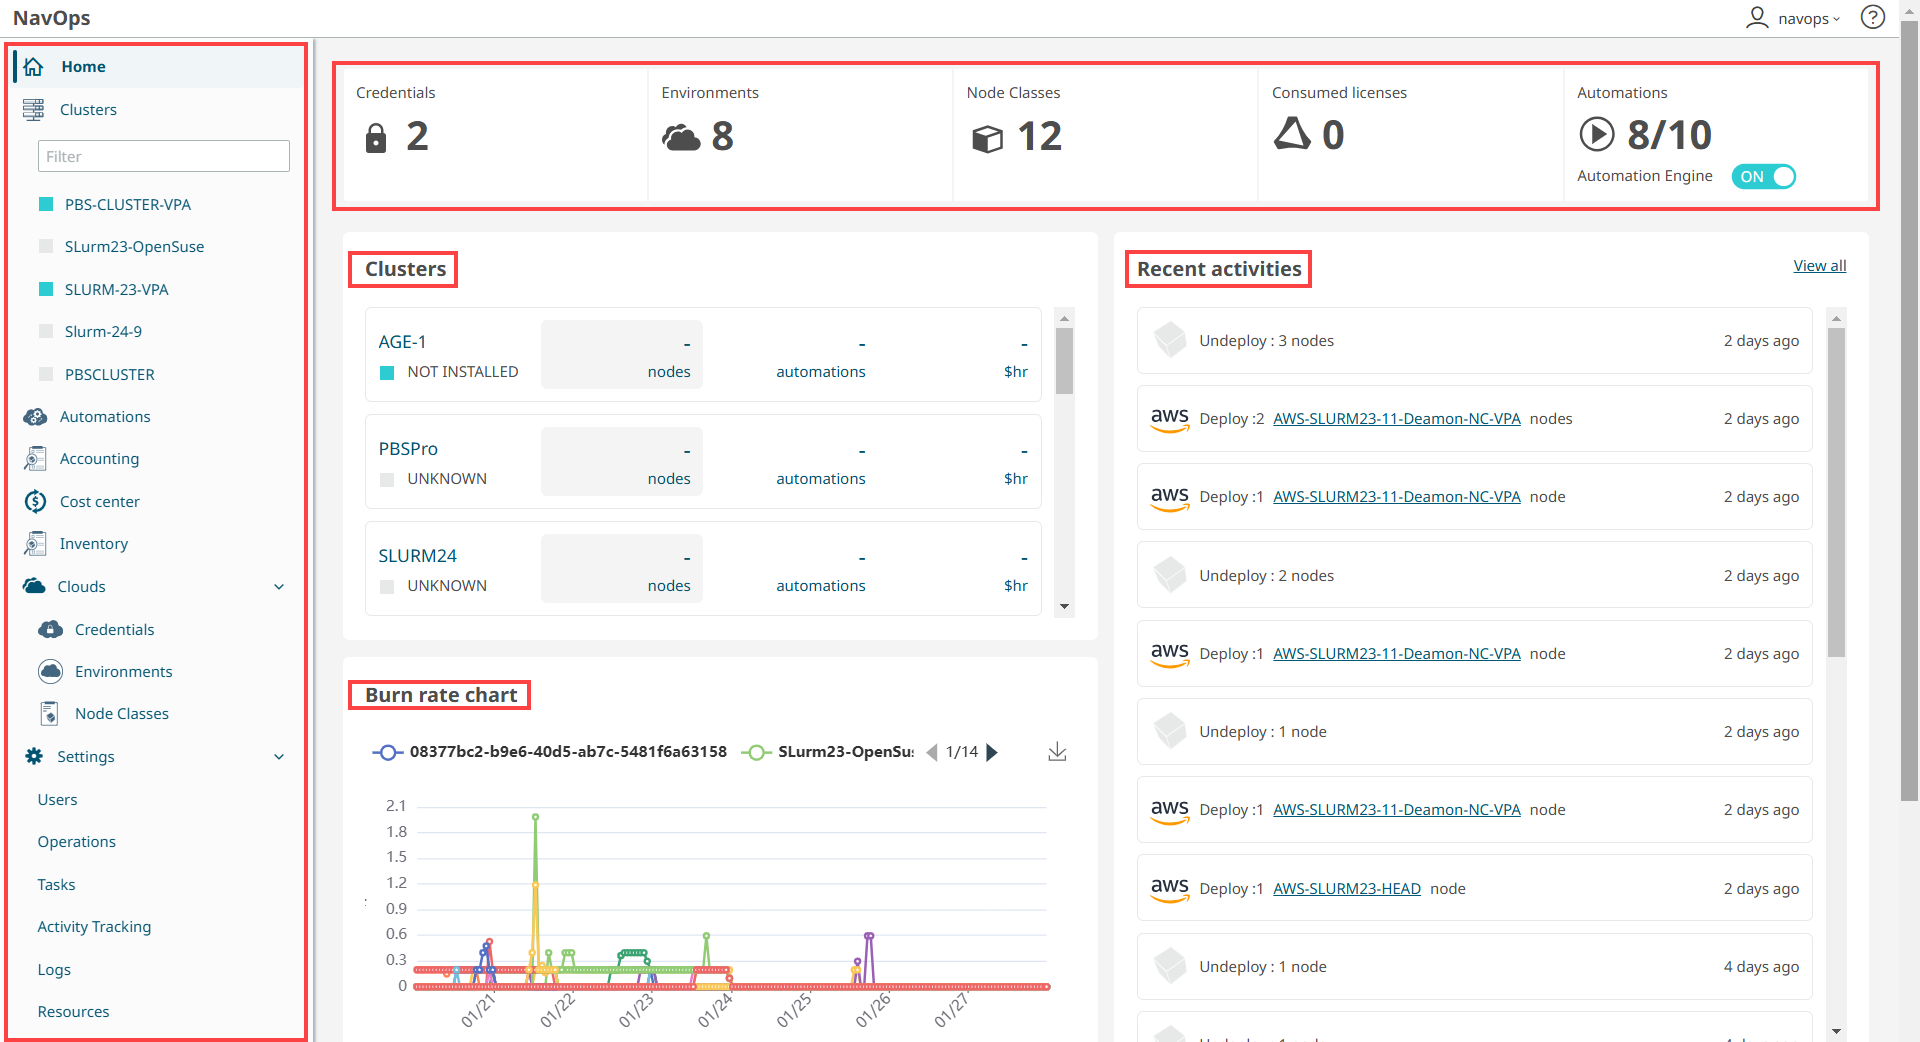
NavOps Menu
You can access Clusters, Automations, Accounting, Cost center, Inventory pages from the side navigation bar. You can also access the Clouds menu for Credentials, Environments and Node Classes. The Settings menu contains Users, Operations, Tasks, Activity Tracking, Logs, and Resources. Click the username to access the API Keys and Log out from NavOps.
Cloud and Automations
The number of credentials, environments and node classes and licenses consumed are displayed at the top. You can enable or disable the automation engine. The number of current automations is also displayed.
Clusters List
All the registered clusters and their status are displayed in the clusters list. You can hover over the nodes tile to get further details. The top five frequently used clusters are displayed in the sidebar. You can bookmark clusters from the clusters page to display them in the list in the side bar.
Recent Activities
Recent activities are displayed in the home page. You can inspect the result for the activities or click View all to go to the Tasks page.
Burn Rate Chart
A Burn rate chart indicating the cost ($/h) for the last seven days is displayed at the bottom on the home page.