Accounting
The accounting dashboard provides a set of reports containing charts and tables tracking Burn Rate, Core Count, Node Count and Total Cost for the Cloud connector, Cloud credentials, Cloud environment, Node class and Cluster datasets. These reports can be produced for a custom date and time range or a set of preset date and time ranges.
To view the accounting reports:
- Login to NavOps.
- Click Accounting in the navigation bar.
-
Select the Report Type:
- Burn Rate ($/h) : This is the burn rate for $ at the sample time based on the instance cost ($/h) reported by the cloud vendor.
- Core Count
- Node Count
- Total Cost: This is an accrual of the cost for the reported time period. It will start at 0 at the start of the time period and accrue to the end of the selected time period.
-
In Configuration, select a preset date and time range:
- Current Day
- Current Week
- Current Month
- Current Quarter
- Current Year
- Last Day
- Last Month
- Last Quarter
- Last Year
- Select a custom From and To date and time, using the Calendar.
-
Select the Data Series
- Cloud connector
- Cloud credentials
- Cloud environment
- Node class
- Cluster
The accounting chart is displayed for the specified configuration.Figure 1. Burn Rate for Node class for Current Month 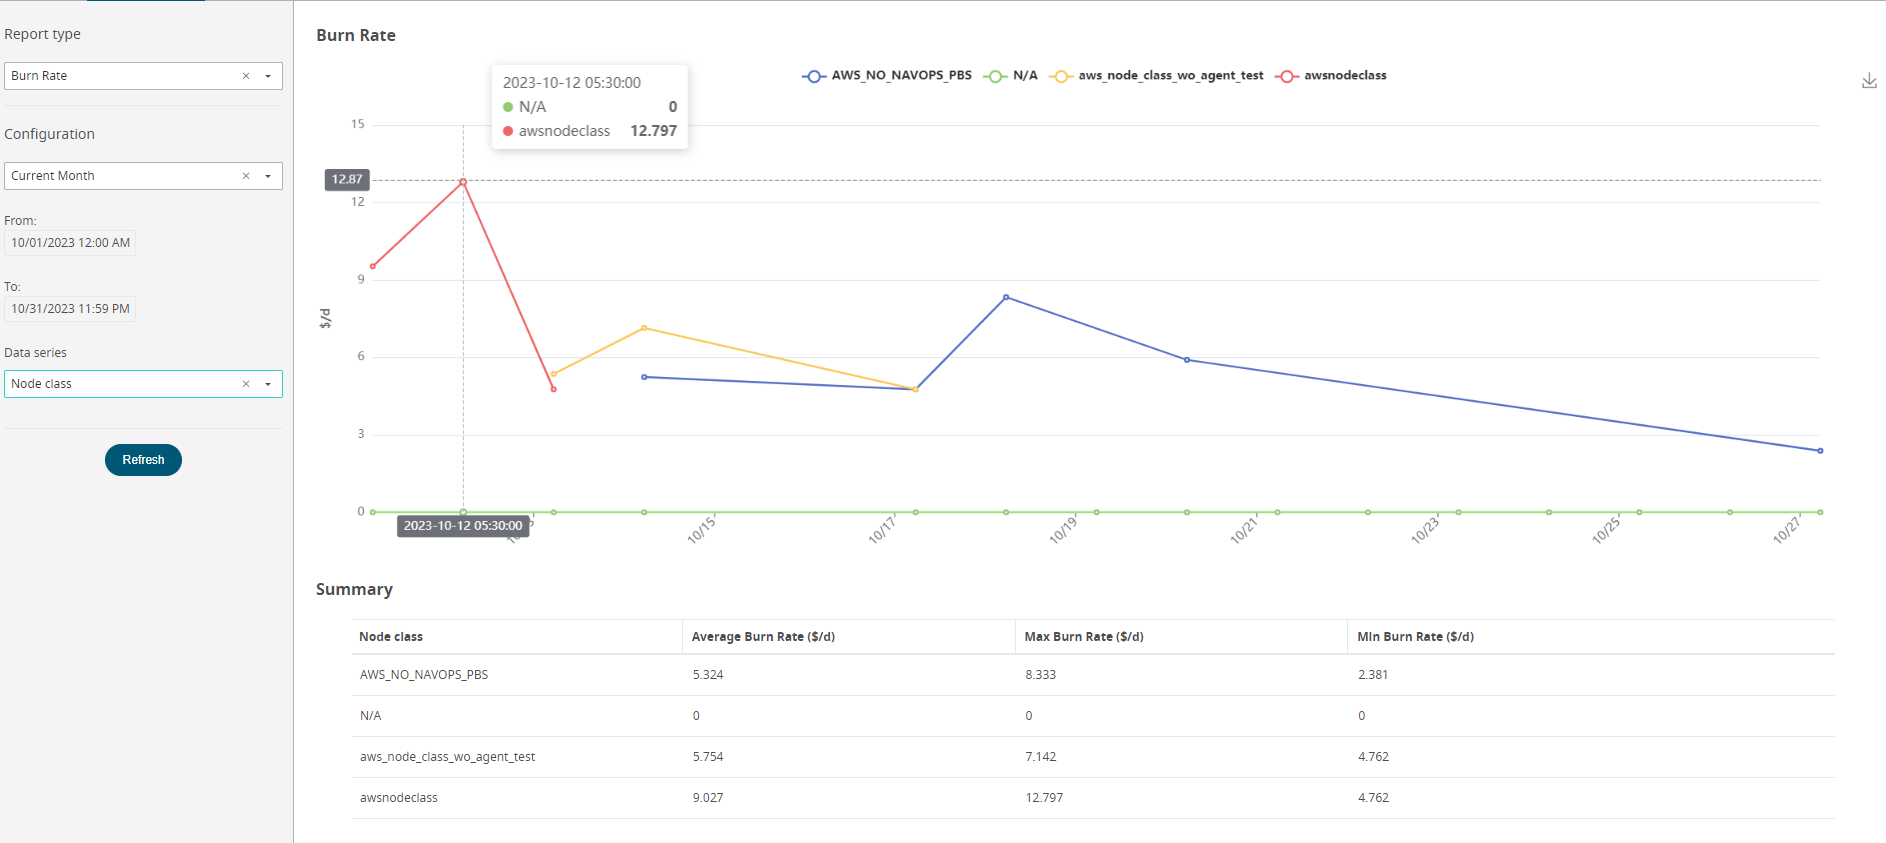
- Hover over the data points to see the exact values.
- Click the legend to toggle the display of the curve.
-
Click (
 ) to save the chart as an image.
- Summary table below the chart displays the Average, Maximum and Minimum Values.