Visualize Element Density
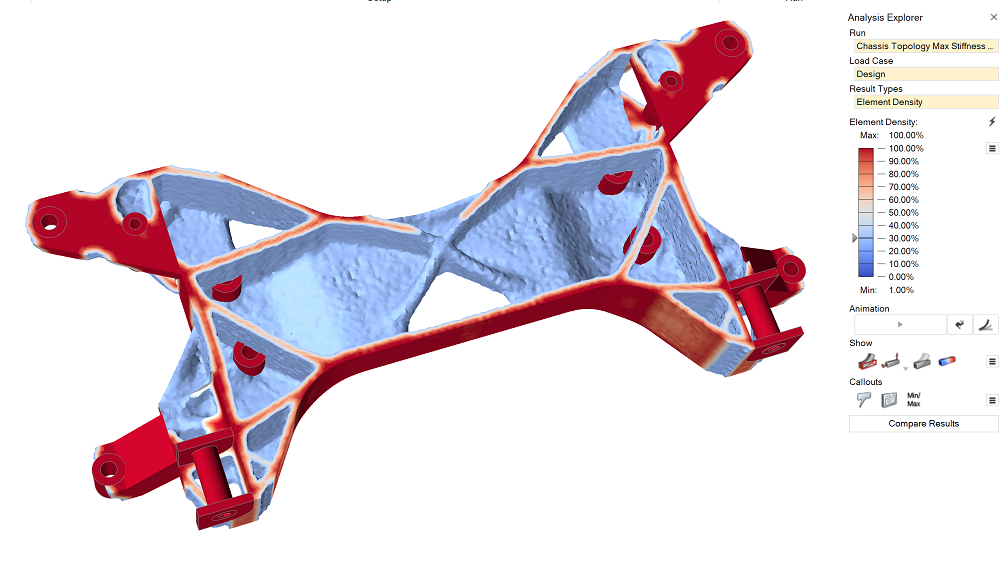
The element density result type shows where material on the part is most dense and needs to be retained. This result type is available for all topology optimization runs.
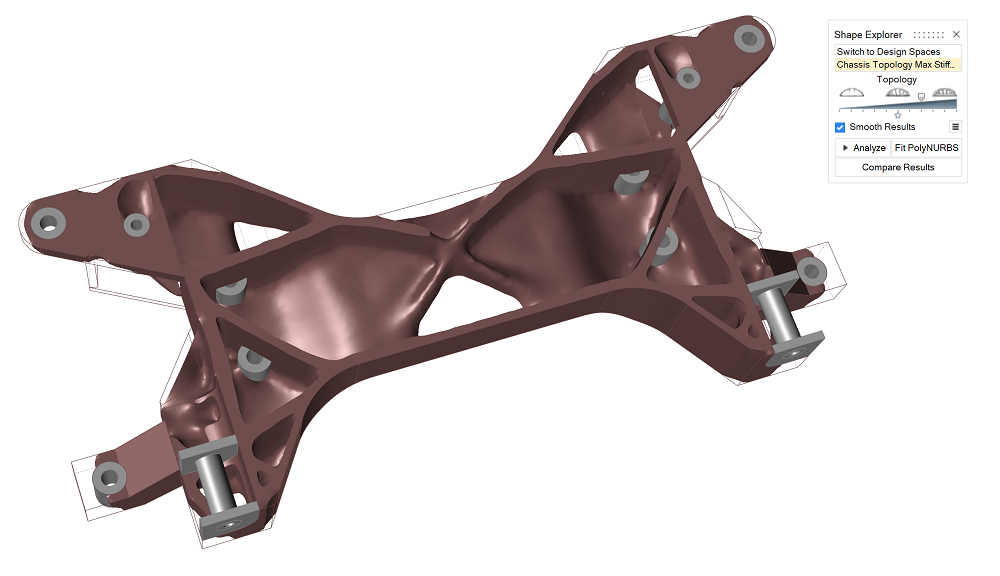
The element density slider on the Analysis Explorer corresponds to the topology slider on the Shape Explorer. Anything shown as white to red is a highly loaded area and must be retained.
-
To visualize the element density, first run a topology optimization.

-
On the Structures ribbon, click Show Analysis Results on
the Analysis icon.

Tip: To find and open a tool, press Ctrl+F. For more information, see Find and Search for Tools.The Analysis Explorer appears and displays the element density results.
- Optional:
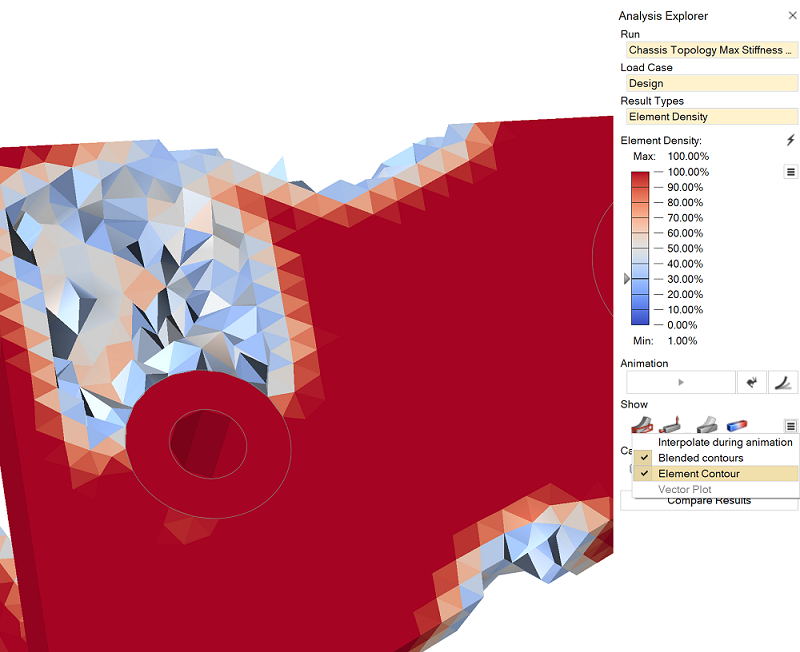
If you want to see the exact element density value, click the
 icon and select Element
Contour.

Tip:
- You can animate and record the optimization steps using the Animation toolbar. (The final step is the final optimization result.)