
Analysis Explorer Options
The Analysis Explorer includes options that allow you to select a run, display a result type, add callouts, and adjust how the results are shown.
Run
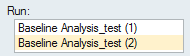
To delete a run from the Analysis Explorer, right-click the run name to select Delete Run.
Load Case
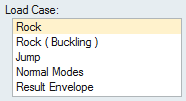
The Result Envelope is created when you have two or more static load cases. It shows the maximum value for each result type across all load cases.
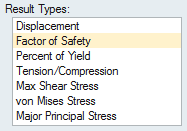
Result Types
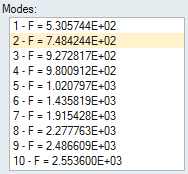
Modes
All physical objects have frequencies at which they vibrate that are called normal modes. If you chose to run a normal modes analysis in the Run Analysis window, the modes will be listed here when you select Normal Modes for the Load Case. Click on a mode to view the displacement for that mode.
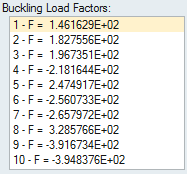
Bucking Load Factors
Results Slider
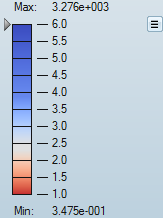
- To change the upper or lower bound for the results slider, click on the
bound and enter a new value. Click the reset
 button to restore the default values.
 - To filter the results so that areas on the model with results greater than a
specified value are masked, click and drag the arrow on the results slider.
To mask areas with results less than the specified value, click
 and select Flip Mask.
Select the arrow to enter a specific value.
and select Flip Mask.
Select the arrow to enter a specific value. - To change the legend color for the result type, click the icon next to the results slider and select
Legend Colors.
- To apply the min/max values for the current result type to all load cases,
click the icon next to the results
slider and select Apply current min/max to all load
cases.
- To reset the min/max values for the current result types for all load cases,
click the icon next to the results
slider and select Reset min/max of all load
cases
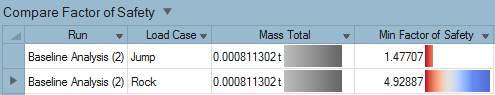
Compare Results
Click the Compare Results button at the bottom of the Analysis Explorer to view a table that allows you to compare analysis runs.
Results are compared in a table format. Additional columns can be added to show additional result types and parameters from the Run Analysis window. The red-blue color bands correspond to the legend in the Analysis Explorer; the width of the band indicates the magnitude of the result. Changes to the upper and lower bound in the Analysis Explorer are automatically reflected in the Compare Analysis Results table.
- Select a row to display the results for that run and load case.
- Double-click a cell in the table to show that result in the modeling window
- Click the chevron next to the table title to select a different result type or a callout.
- Click the chevron on a column header to filter results.
- Click a column header to sort the column
- Right-click a column header to change what result types, run parameters, or callouts are shown in the table.
- Click the top left corner of the table to copy the contents of all cells. This can then be pasted into Excel.
Show/Hide Elements
When the Analysis Explorer is active, an additional Show/Hide Elementsicon appears under the view controls in the lower left corner of the modeling window