Import and Plot Flutter Curves
Use the Flutter Curve tool to process flutter data by cross-plotting selected result quantities from the flutter solution results.
-
From the Aeroelasticity ribbon, click the
Flutter Curve tool.

- Make your selections.
-
Click Plot.
Figure 1. 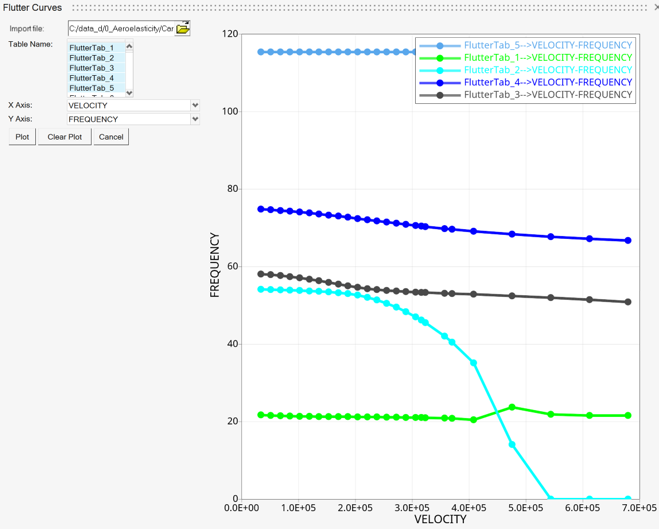
Supported OptiStruct solver cards:- OptiStruct Bulk Data cards
- FLUTTER
- Define flutter loading for flutter analysis
- FLFACT
- FLUTTER
- Solution control
- ANALYSIS = FLUTTER
- AEROF
- APRESS
- AESYMXY
- AESYMXZ
- OptiStruct Bulk Data cards