HS-4415: Optimization Study of a Landing Beam Using Excel
Learn how to perform an optimization study in which the input variables are entered and the output responses are calculated in a Microsoft Excel spreadsheet.
The objective is to find the cross-sectional dimensions of a tapering I- beam at its three sections that minimize the total cross-sectional area while meeting the margin of safety requirements for buckling, crippling, and combined bending and shear under ten loadcases.
The spreadsheet used here contains a page with the initial design and separate pages for crippling, buckling, and combined bending and shear calculations.
Create Matrix Input
In this step, you will create a matrix input that HyperStudy can evaluate.
- In Excel, open the LandingBeamCalc_Public.xls spreadsheet.
-
Review the information, and locate the columns that contain the input variables
and output responses.
Note: When creating a Spreadsheet model for HyperStudy on a Mac or Windows platform, variable labels should only contains English characters, or a combination of English characters and numbers.
Perform the Study Setup
- Start HyperStudy.
-
Start a new study in the following ways:
- From the menu bar, click .
- On the ribbon, click
 .
.
- In the Add Study dialog, enter a study name, select a location for the study, and click OK.
- Go to the Define Models step.
-
From the Directory, drag-and-drop the
LandingBeamCalc_Public.xls file into the work
area.
The Solver input file column displays hst_input.hstp, this is the name of the solver input file HyperStudy writes during any evaluation. The Solver execution script column now displays SpreadSheet_HST.
Figure 1. 
- Optional: If a firewall prompt dialog appears, click Allow.
-
Click Import Variables.
The LandingBeamCalc_Public.xls spreadsheet opens.
- Go to the Define Input Variables step.
-
Add input variables.
-
Add output responses.
Perform Nominal Run
- Go to the Test Models step.
-
Click Run Definition.
An approaches/setup_1-def/ directory is created inside the study Directory. The approaches/setup_1-def/run__00001/m_1 directory contains the input file, which is the result of the nominal run.
Run Optimization
-
Add an Optimization.
- In the Explorer, right-click and select Add from the context menu.
- In the Add dialog, select Optimization.
- For Definition from, select Setup and click OK.
- Go to the step.
- Click the Objectives/Constraints - Goals tab.
-
Apply an objective on the Area ACE output response.
- Click Add Goal.
- In the Apply On column, select Area ACE (r_10).
- In the Type column, select Minimize.
Figure 4. 
-
Apply constraints.
- Click Add Goal nine times.
- Define Goal 2 through Goal 10 by selecting the options indicated in the Figure 5.
Figure 5. 
- Go to the step.
- In the work area, set the Mode to Sequential Qadratic Programming (SQP).
- Click Apply.
- Go to the step.
- Click Evaluate Tasks.
-
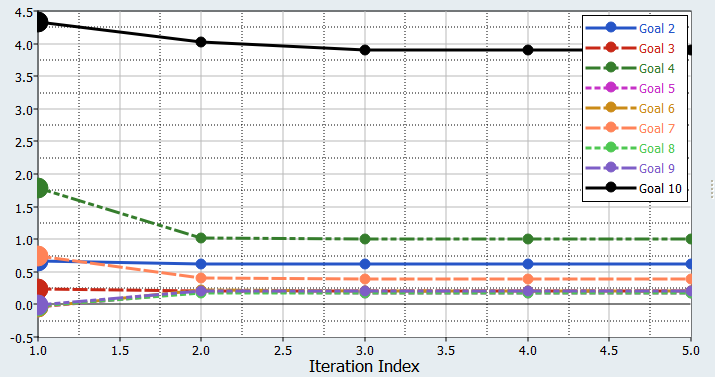
Review iteration history.
- Click the Iteration Plot tab to monitor the progress of the Optimization iteration.
- Using the Channel selector, select Goal 2 through Goal 10.
Figure 6. 

