Learn how to use the Readmac delegate for mode tracking applications.
Before you begin, copy the model files used in
this tutorial from <hst.zip>/HS-4410/ to your working
directory.
In this tutorial you will set up an optimization problem with the objective of
maximizing the first natural frequency of a simple rectangular section beam.Figure 1. Bar Cross-Section of the Beam Element from HyperBeam
Perform the Study Setup
Start HyperStudy.
Start a new study in the following ways:
From the menu bar, click File > New.
On the ribbon, click .
In the Add Study dialog, enter a study name, select a
location for the study, and click OK.
Go to the Define Models step.
Add a Parameterized File model.
From the Directory, drag-and-drop the Bar_beam.tpl
file into the work area.
Figure 2.
In the Solver input file column, enter
Bar_beam.fem.
This is the name of the solver input file HyperStudy writes during the
evaluation.
In the Solver execution script column, select OptiStruct (os).
Click Import Variables.
Two input variable is imported from the .tpl
resource file.
Go to the Define Input Variables step.
Review the input variable's lower and upper bound ranges.
Perform Nominal Run
Go to the Test Models step.
Click Run Definition.
An approaches/setup_1-def/ directory is created
inside the study Directory. The
approaches/setup_1-def/run__00001/m_1 directory
contains the input file, which is the result of the nominal run.
Create and Evaluate Output Responses
In this step you will create three output responses that are based on elements of a
single data source from the Readmac delegate.
Go to the Define Output Responses step.
Create a data source.
Click the Data Sources tab.
From the Directory, drag-and-drop the Bar_beam.h3d
file, located in
approaches/setup_1-def/run__00001/m_1, into the
work area.
The Data Source Builder dialog
opens.
For Tool, select Modal Assurance Criteria.
Under Reference, define the options as show in Figure 3.
File: Navigate to
approaches/setup_1-def/run__00001/m_1/Bar_beam.h3d
Note: The
file source uses a relative position of the
Bar_beam.h3d file, and updates for
successive run numbers. However, the reference file uses an
absolute path and points to the given file source throughout
all the runs.
Subcase: Subcase 1 (loadstep1)
Type: Eigen Mode (Grids)
Mode: Reference mode index = 1
Under Target, maintain the default settings.
The default Target settings adopt the same Type and Subcase as the
Reference settings, which enables HyperStudy to search all modes for
the best match in the reference file.
Click OK.
Figure 3.
Create and define output responses.
Click the Define Output Responses tab.
Click Add Output Responses to add three output
responses.
Label the output responses Freq of best matched
mode, MAC of matched mode, and
ID of matched mode.
In the Expression field, enter the following expressions for each
output response:
Freq of best matched mode = ds_1[0]
MAC of matched mode = ds_1[1]
ID of matched mode = ds_1[2]
Figure 4.
Click Evaluate to extract the response values.
Run Optimization
Add an Optimization.
In the Explorer, right-click and select
Add from the context menu.
In the Add dialog, select
Optimization.
For Definition from, select Setup and click
OK.
Go to the Optimization > Definition > Define Output Responses step.
Click the Objectives/Constraints - Goals tab.
Apply an objective on the Freq of best matched mode output response.
Click Add Goal.
In the Apply On column, select Freq of best matched
mode.
In the Type column, select Maximize.
Figure 5.
Go to the Optimization > Specifications step.
In the work area, set the Mode to Adaptive
Response Surface Method (ARSM).
Note: Only the methods that are valid for the problem formulation are enabled.
Click Apply.
Go to the Optimization > Evaluate step.
Click Evaluate Tasks.
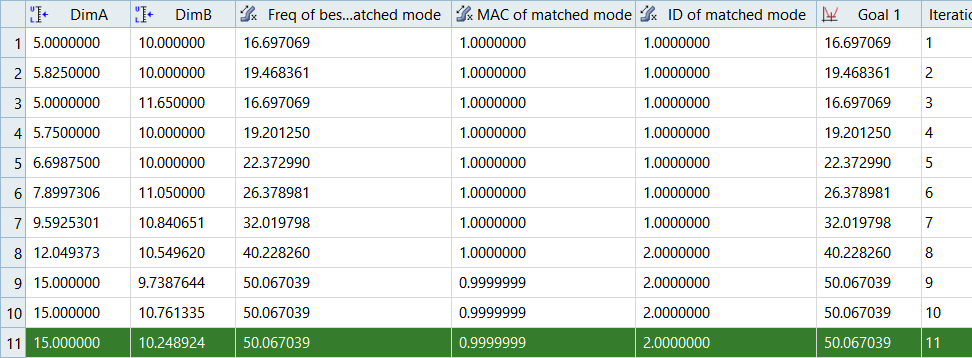
Click the Iteration History tab.
The frequency of best matched mode in the target file is maximized to
50.067 from 33.388. The readmac function that was running the background was
able to track the ID of the matched mode in the target .h3d
file. The mode ID in the converged solution switched from 1 to 2.Figure 6.


 .
.