Viewing the Near Field Results (2D)
Create a new Cartesian graph. Create two near field traces and compare the Ey and Ex components of the near field along the X direction.
-
Create a new Cartesian graph.
-
On the Home tab, in the
Create new display group, click the
 Cartesian icon.
-
On the Home tab, in the
Create new display group, click the
-
Add the near field result to the Cartesian graph.
-
On the Home tab, in the
Add results group, click the
 Near Fields icon. From the drop-down list, select
NearField1.
Near Fields icon. From the drop-down list, select
NearField1.
-
On the Home tab, in the
Add results group, click the
-
View the near field along the X direction.
-
On the result palette, in the Slice panel, make the following changes:
- From the Independent axis (Horizontal) list, select X position.
- From the Frequency list, select 1.645 GHz.
- From the Y position list, select 100 mm.
- From the Z position list, select 460 mm.
Figure 1. The Slice panel in the result palette. 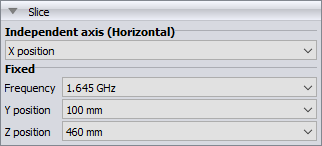
-
On the result palette, in the Slice panel, make the following changes:
-
View the magnitude of the Ey component of the field.
-
On the result palette, in the
Quantity panel, clear the
X check box and the
Z check box.
Figure 2. The Slice and part of the Quantity panels in the result palette. 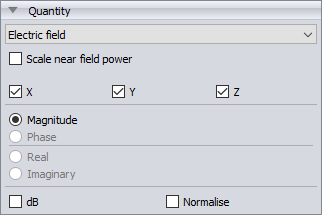
-
On the result palette, in the
Quantity panel, clear the
X check box and the
Z check box.
-
Add a second trace to the Cartesian graph by duplicating
the NearField1 trace.
-
On the Trace tab, in the
Manage group, click the
 Duplicate trace icon.
A second trace, NearField1_1, is created. -
On the Trace tab, in the
Manage group, click the
-
View the magnitude of the Ex component of the field.
- On the result palette, select the NearField1_1 trace.
- On the result palette, in the Quantity panel, select the X check box and clear the Y check box.
-
Set the vertical axis to dB.
- In the result palette, select both traces (NearField1 and NearField1_1).
- In the Quantity panel, select the dB check box.
-
Modify the minimum and maximum values for the vertical axis.
-
On the Cartesian
context tab, on the Display tab, on the Axes group, click the
 Axis settings icon.
-
In the Minimum value field, enter a value of
-20.
Figure 3. The Axis settings (Cartesian graph) dialog. 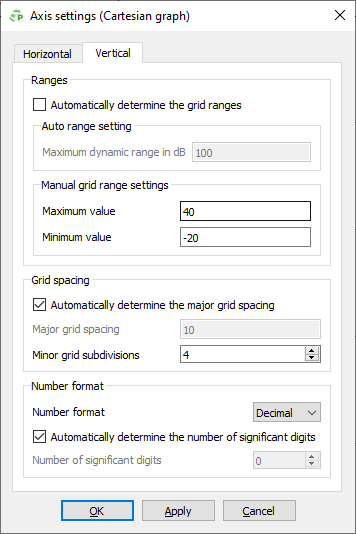
Figure 4. The Ey and Ex components of the near field along the X direction. 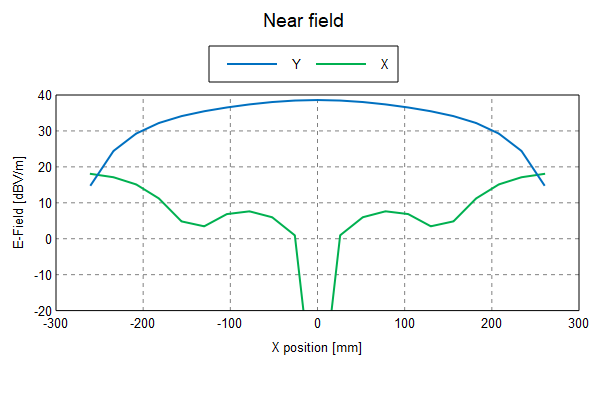
-
On the Cartesian
context tab, on the Display tab, on the Axes group, click the