Viewing the Results
View and post-process the results in POSTFEKO.
-
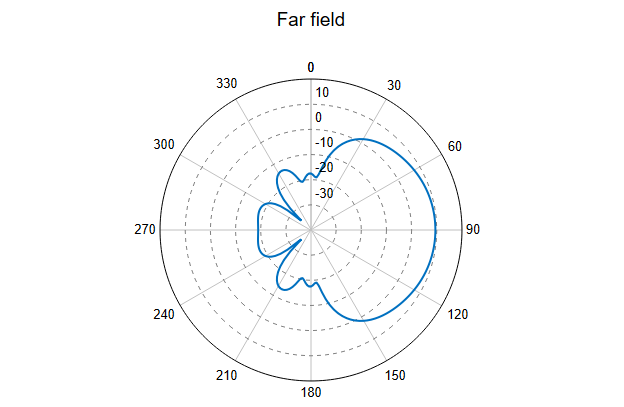
View the vertical gain (in dB) at 46.29 MHz of the requested far field pattern
on a polar plot.
Figure 1. The vertical gain of the LPDA antenna at 46.29 MHz. 
Tip: If the exact frequency is not available in the drop-down list, select Frequency in range and enter the value for the frequency in Hz. -
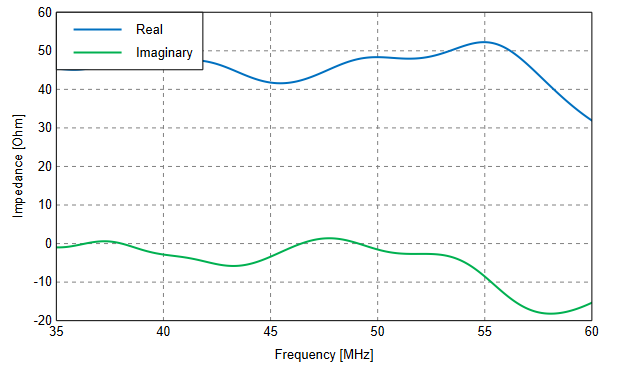
View the input impedance (real and imaginary) over the operating band on a
Cartesian graph.
Figure 2. The input impedance (real and imaginary) of the LPDA antenna over the operating band. 