EDEM Analyst - Analyze Your Results
Learn how to review, examine, and analyze the results of the simulation using EDEM Analyst.
-
Click the
 icon
on the Toolbar.
-
Use the controls
 below the simulation window to rewind the simulation to the first Time
Step.
-
Click the
 icon to play through each Time Step of your simulation.
Configure the Display
You can use the Display section in the Analyst Tree to configure the appearance of the different elements in your model. The Geometry, particles, and contacts within your model can also be colored in a variety of ways. Any section of Geometry, particle, contact type, or selection group can be colored independently.
-
Configure the Particles subsection.
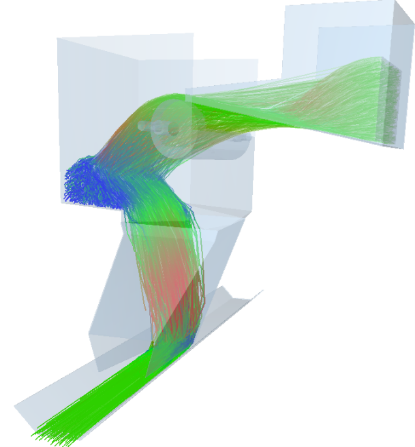
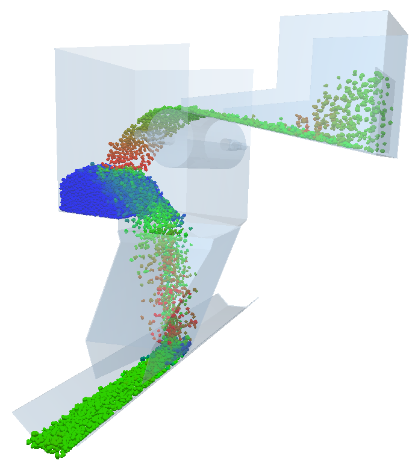
You can alter the display of the particles in a similar way as that of the Geometry. In addition, the particles can be represented using a number of different forms, such as cones, streams, and vector that traces the direction in which the particles move.
- Click the
 icon to rewind the simulation.
 - Select the Grain particle subsection in the
Analyst Tree.Note: To be able to view this section, at least some particles must be generated in the domain.
- Click the
 icon to view the Grain particle.
 - Select Vector from the Representation type dropdown list .
- Click the
 icon to view how the direction of movement
of the particle changes over time.
 - Click the
 icon at any point and set the
Representation type back to
Default.
- Click the
- Click the Apply All.
-
Use the controls that are located at the bottom of the Viewer window to watch
the simulation.
The following images show Stream and Default particle representations:
- Expand Particles in the Analyst Tree and then select rock particle_1.
- Select Template from the Representation dropdown list to represent particles.
- Click Options….
- Set the Template to Rock_Template 1.
- If present, click Apply.
-
Repeat the same steps for rock particle_2 and set the associated template to
Rock_Template 2.
The particles are now displayed by their associated CAD templates.
Color Elements
The next step is to color particles, Geometry and contacts within your model. Any section of Geometry, particle, contact type, or selection group can be colored independently.
- Select rock particle in the Particles subsection of the Analyst Tree.
- In the Coloring section of the Detailed View, select Velocity in the Color by dropdown list.
- Select 3 levels of coloring and set the Min, Mid, and Max colors to Blue, Green, and Red respectively.
- Click next to the Min Value and Max Value fields to read the current values from the point in the simulation displayed in the Viewer.
- Clear the Auto Update checkbox and set the Min Value to 0 m/s and Max Value to 7 m/s.
- If present, click Apply to color the
particles.
If Auto Update is enabled, the display will automatically reflect these changes and the Apply button will not be displayed.
- Select the Show Legend checkbox then click Apply.
- Repeat the same steps for rock particle_2 and rock_particle_3.
- Rewind the simulation back to the start and click the
 icon to view the distribution of velocity
over time.
Modify Selections
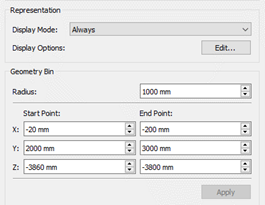
After creating the mass flow sensor and grid bin group, recreate these two selections. However, the queries remain unchanged from what was previously created.
- Select Mass Flow Sensor 01 from the Analyst Tree.
- Modify the properties of the bin group as follows:
- Click Apply.
Plot Graphs
The last step in this tutorial is to learn how to plot new graphs for this configuration.
-
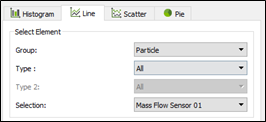
Plot a linear graph of mass flow rate of all particles changing over time on
the bottom conveyor.
- Click the
 icon on the toolbar. Note: If you cannot see this icon on your toolbar, expand the Standard toolbar.
 - Select the Line tab, and set the parameters as follows:
- In the X-axis tab, ensure that the Start and End fields in the Time Range section cover the whole simulation time.
- Click the Y-axis tab and select Mass Flow Rate from the Primary Attribute dropdown list.
- Click Create Graph to plot the graph.
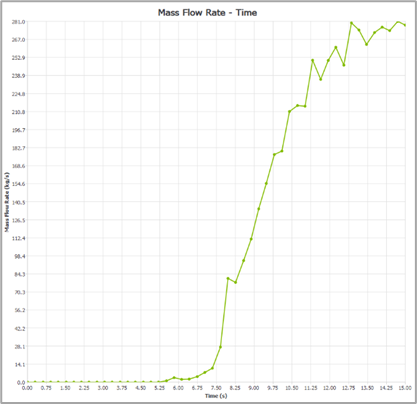
Note: From the graph, you can see that the first particles flow through the sensor after about 5.5 seconds of simulation, and that a steady-state may not yet have been reached after 10 seconds.
- For a more detailed view of the end of the plot:
- In the X-axis tab, set the Start time to about 6s.
- Click Create Graph to view the new
plot.
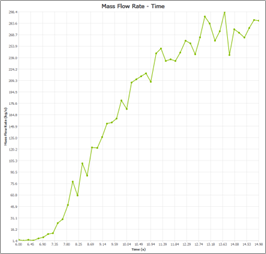
Note: To generate a graph of the mass flow rate when the system reaches steady state, the simulation can be run for an extended period of time.
- Click the
-
Plot the graph of the total particle mass in the rock box.
The bin group over the rock box registers the change of total mass of the particles.
- Select the Line tab and set the parameters as follows:
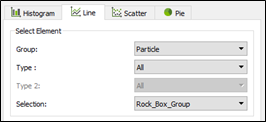
- In the X-axis tab, ensure that the Start and End fields in the Time Range section cover the whole simulation time.
- Click the Y-axis tab and set the Primary Attribute to Mass and the Component to Total.
- Click the Y-axis tab and select Mass from the Primary Attribute dropdown list.
- Select Total from the Component dropdown list.
- Click Create Graph to plot the graph.
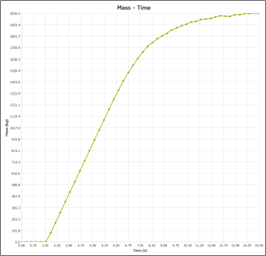
- Modify the Start time in the X-axis tab.
- Plot a pie chart of the percentage distribution of each particle type in
the rock box.
You can also use
Rock_Box Groupto analyze the content of different particle types in the rock box. -
- Select the Pie tab and set the parameters as follows:
- Click the Y-axis tab and set the Primary Attribute to Mass and the Component to Total.
- In the Define Attribute tab, select Number of Particles from the Attribute dropdown list.
- Select Total from the Component dropdown list.
- In the Settings tab, select the Current Time
Step checkbox.
The number of particles at the Time Step when the simulation is stopped is displayed.
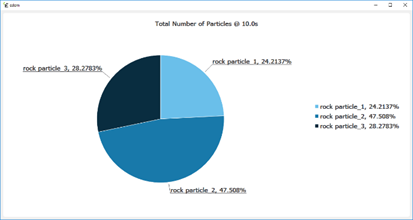
- Click Create Graph. The following image represents the final Time Step of 10.0s and the most common type of particle is rock particle_2:
- Modify the Attribute to Mass, and select Total from the Component dropdown list as done previously.
- Click Create Graph to view a new
pie chart for the same Time Step. Note: Notice that the distribution of mass is approximately equal for all particles types, as expected. The previous graph showed that the most common particles was rock particle_2. As these are the least dense of the three particle types, more particles are needed to match the specified mass flow rate (100 kg/s per particle type) as compared to the other two particle types.
- Select the Pie tab and set the parameters as follows:
- Select the Line tab and set the parameters as follows: