Spatial Impulse Response
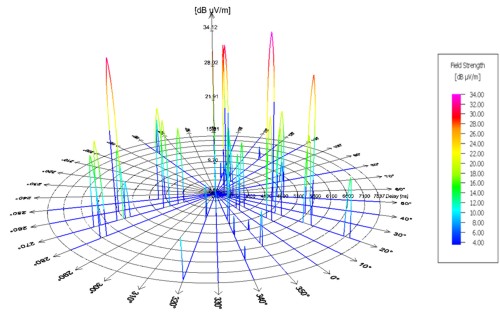
The spatial channel impulse response at the mobile station can be analyzed for each computed pixel within the simulation area.
Click to specify an evaluation location by positioning the mouse cursor in the result window. After selecting a location by clicking the left mouse button, the spatial channel impulse response for the current location is displayed in a new window. Within this window, the 3D impulse response can be analyzed by rotating and zooming the graph with the mouse.
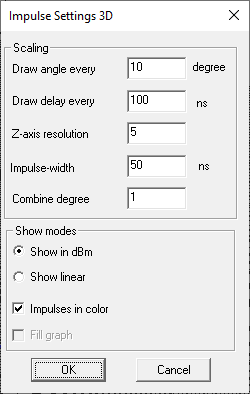
Further adjustments of the graph can be done in the Settings dialog,
which can be reached by clicking the ![]() icon in the toolbar.
icon in the toolbar.
To open the Impulse Settings 3D dialog, right-double click on the spatial channel impulse response.