Surface Prediction Using IRT
Calculate propagation along non-horizontal prediction planes.
Model type
Propagation along non-horizontal prediction planes and which contain buildings are calculated. Sidewalls of buildings were defined as prediction planes in WallMan.
This database was created as if it is an indoor database, while mainly outdoor propagation is of interest. This was done to define prediction planes and to have more freedom to create general shapes as well as to obtain accurate results inside buildings.
The database contained in the file, buildings.idb, was preprocessed to use intelligent ray tracing. The preprocessed database is available in the file, buildings.idi.
Sites and Antennas
The project contains a single site with one sector antenna placed at a height of 35 m. The frequency is 2.5 GHz, with a transmitter power of 40 dBm.
Computational Method
Results
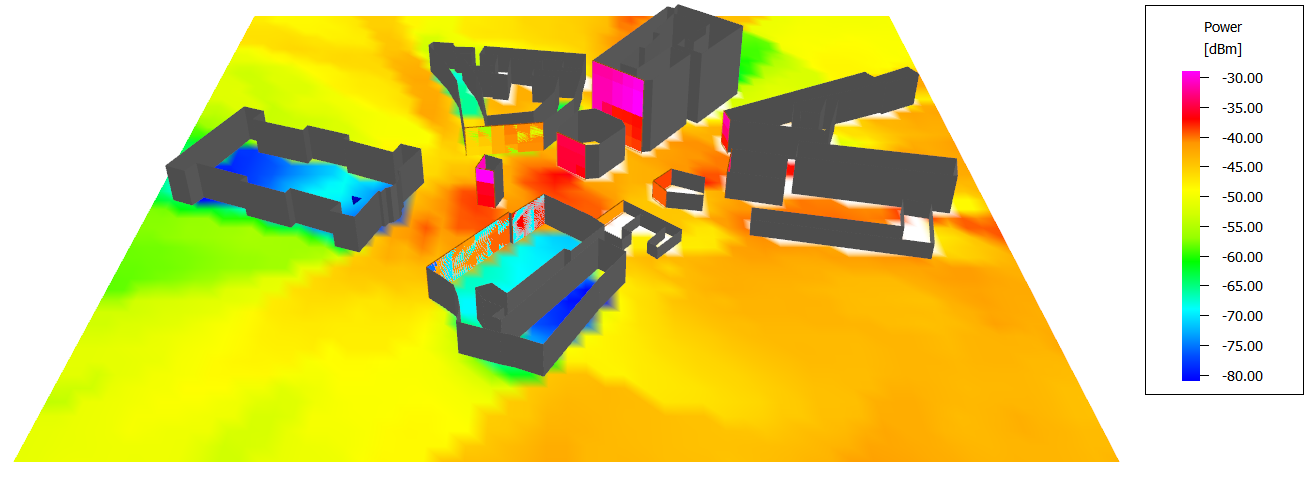
Propagation results show at every location the power received by a hypothetical isotropic antenna. Since some propagation results are on vertical planes, result data are better viewed in the 3D view, see Figure 1. The additional prediction planes can be made visible or hidden from the Additional Result Planes dialog.