
gmonopuls
Generate a sampled Gaussian monopulse.
Syntax
p = gmonopuls(t)
p = gmonopuls(t, fc)
Inputs
- t
- The times at which to generate the signal.
- fc
- The center frequency. (default: 1000 Hz)
Outputs
- p
- The gaussian monopuls.
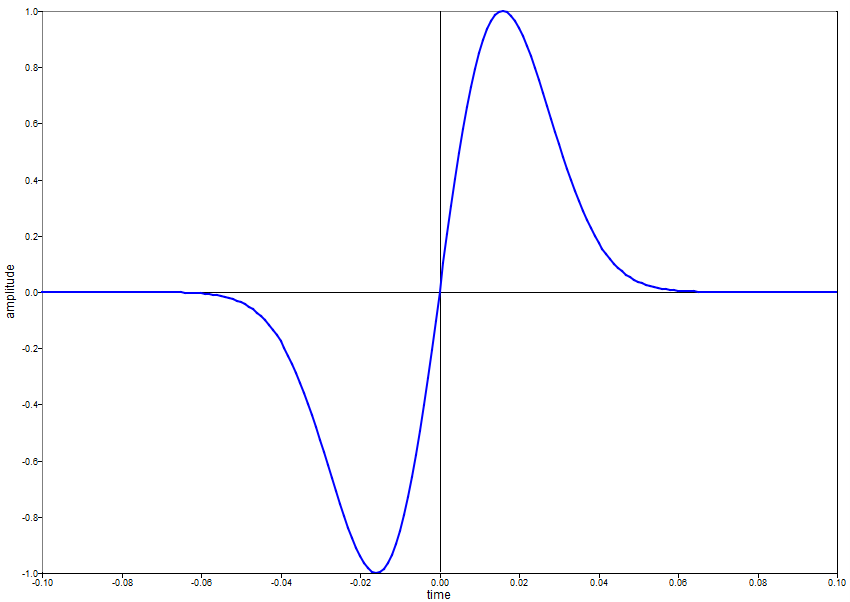
Example
Plot a pulse with a 10 Hz center frequency, sampled at 1000 KHz.
t = [-0.1:0.001:0.1];
fc = 10;
y = gmonopuls(t, fc);
plot(t, y);
xlabel('time');
ylabel('amplitude');
Comments
gmonopuls is commonly used as an input to pulstran.