
Tutorial: Optimizing Gauge
Tutorial Level: Beginner Run and review the results of a gauge optimization.
- Run a baseline analysis of a multipart bracket assembly and view the results
- Define a design space and run a gauge optimization
- Review the results of the gauge optimization
- Run a reanalysis of the optimized shape and compare the results
Overview
Gauge optimization is a type of optimization that finds the optimal thickness of parts. This approach is ideal for minimizing the mass of an assembly. It can also be used to maximize stiffness or frequency of a model when using realistic design constraints like displacement constraints. Note that gauge optimization only works on parts that are defined by surface geometry.
In this tutorial, you will run a baseline analysis and gauge optimization on a typical multipart bracket design space.
Analyze the Baseline Model
Let's start by opening the model, review it and running a baseline analysis.
Performing analysis on a model before setting up optimization helps ensure that constraints and other parameters are reasonable for optimization.
-
Double-click the fabricated_gauge.stmod file to load it in
the modeling window.
Note that it has two load cases, five parts, a concentrated mass, and six mounting locations.

- Make sure the display units in the Unit System Selector are set to MPA (mm t N s).
-
On the Structure ribbon, click the Run OptiStruct
Analysis
 button in the
Analyze tool group to open the Run OptiStruct
Analysis window.
button in the
Analyze tool group to open the Run OptiStruct
Analysis window.

Tip: To find and open a tool, press Ctrl+F. For more information, see Find and Search for Tools. -
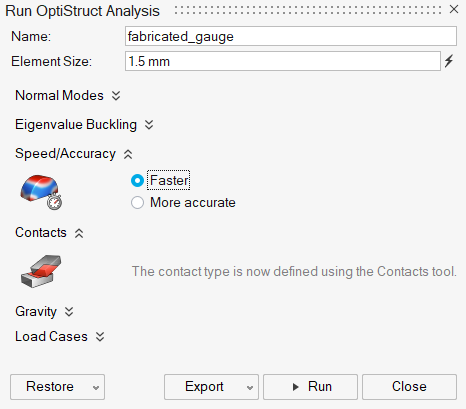
Run the analysis using the following settings:
- Change the Element size to 1.5 mm.
- Set Speed/Accuracy to Faster.
- Click Run to perform the analysis.
Review the Baseline Analysis Results
-
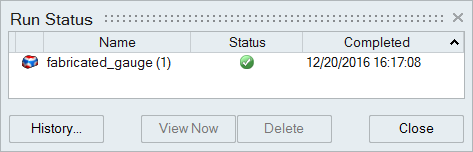
When the run is complete, select it in the Run Status window and click View
Now to see the results.
-
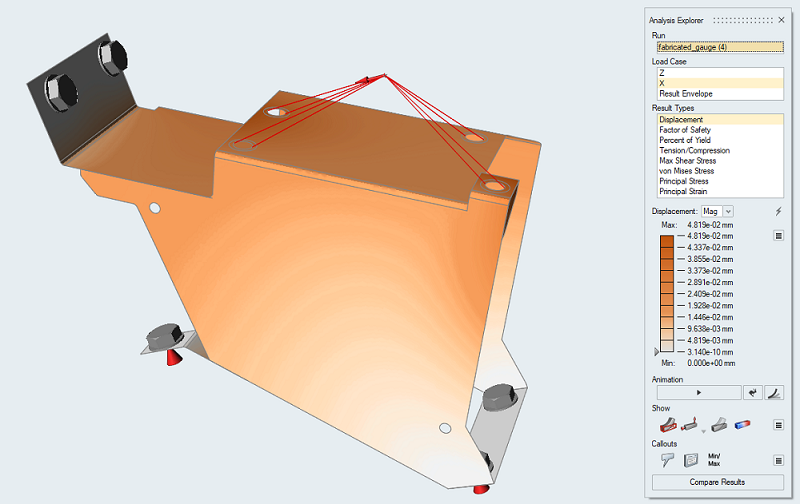
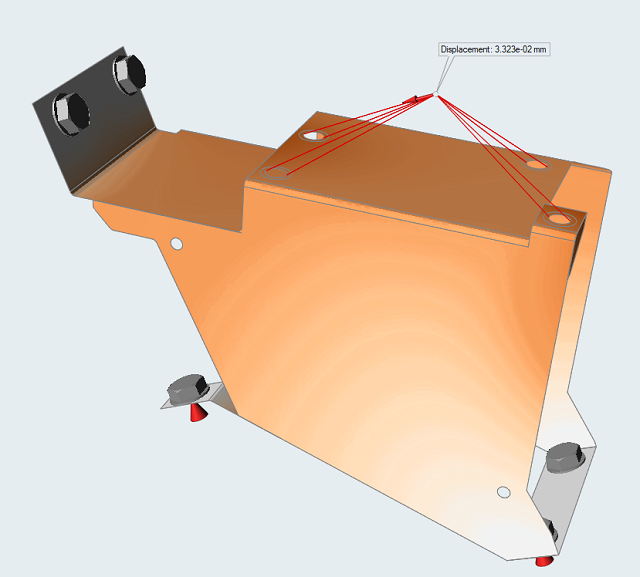
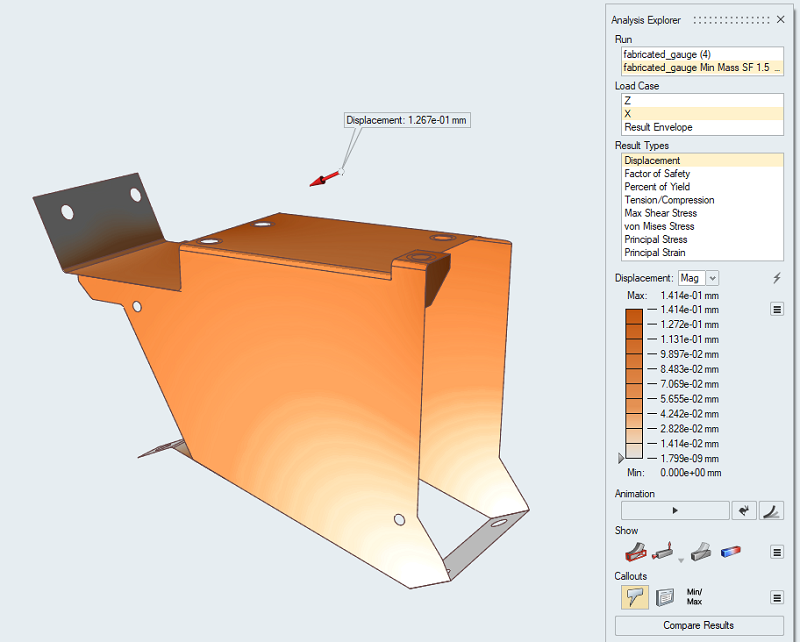
In the Analysis Explorer, select Displacement from the
Result Types dropdown and make note of the maximum
for both load cases.
We will not use them in this tutorial, but these displacements can be used as good constraints when running an optimization.
-
In the Analysis Explorer, click the Create, Show, and Hide
Callouts
 button under Callouts and
click to place a callout at point 1.
button under Callouts and
click to place a callout at point 1.
- Close the Analysis Explorer.
Define the Design Space
Next, we'll set the design space for the optimization.
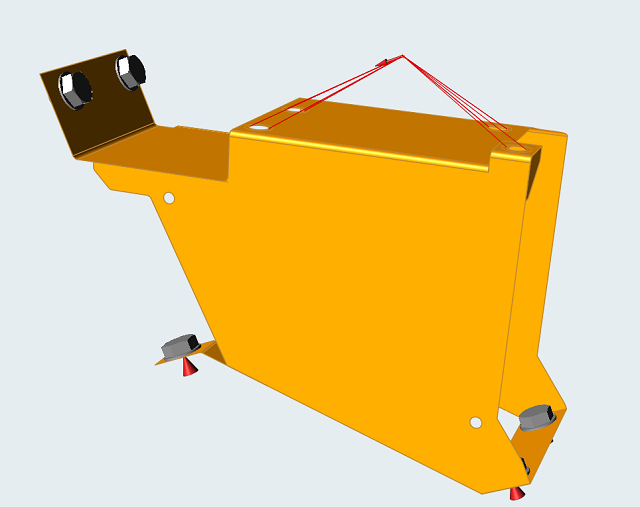
- In the Model Browser, hold Ctrl and select the main, rear, upper, and stiffener parts.
-
Right-click on the selected parts in the Model Browser and select
Design Space from the context menu.
-
Click on empty space in the modeling window.
The design spaces are shown below:

Run a Gauge Optimization
-
On the Structure ribbon, click the Run Optimization
button on the
Optimize tool group icon to open the Run Optimization
window.

-
Run the optimization with the following settings.

View the Results in the Shape Explorer
-
When the run is complete, select it in the Run Status window and click
View Now to see the results.

-
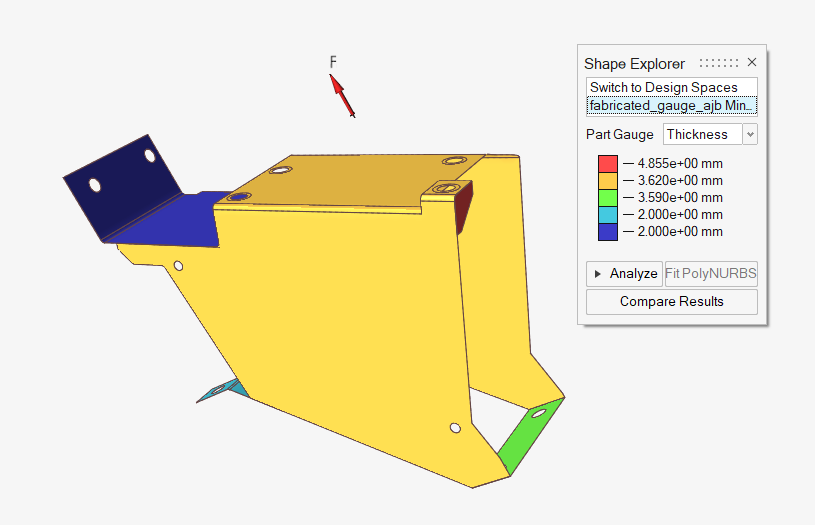
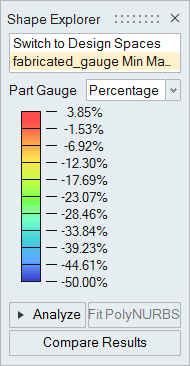
In the Shape Explorer, review the part gauge Thickness results.
Each thickness is assigned a different color, as shown in the legend.
-
Select Percentage from the Part
Gauge dropdown and review the percentage thickness
results.
This time the results are color coded according to the percentage change in thickness.
-
You can also review the mass of each design space vs the optimized shape in the
Model Browser by switching between the design space and the gauge results at the
top of the Shape Explorer.
Note: To display masses in the Model Browser, right-click the Object bar of the browser and select Mass.
Reanalyze the Optimized Shape and Compare Results
-
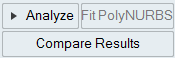
To analyze the optimized shape, click the Analyze button
on the Shape Explorer.
-
When the run is complete, select it in the Run Status window and click
View Now to see the results.
-
In the Analysis Explorer, select Displacement from the
Result Types dropdown and note that the maximum for
both load cases has increased.
This is because we used a minimum safety factor of 1.5 as a design constraint. (If you wish to maintain displacement you can create displacement constraints on your model for different results.)
-
Click the Compare Results button on the Analysis
Explorer to open the Compare Displacement table.
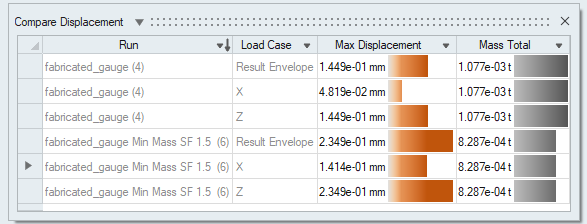
-
Compare the Mass Total and Max
Displacement for each analysis run.
Comparing the baseline to the optimized analysis runs for both load cases shows that the mass has been lowered by optimizing the gauge while still achieving the stress target.