
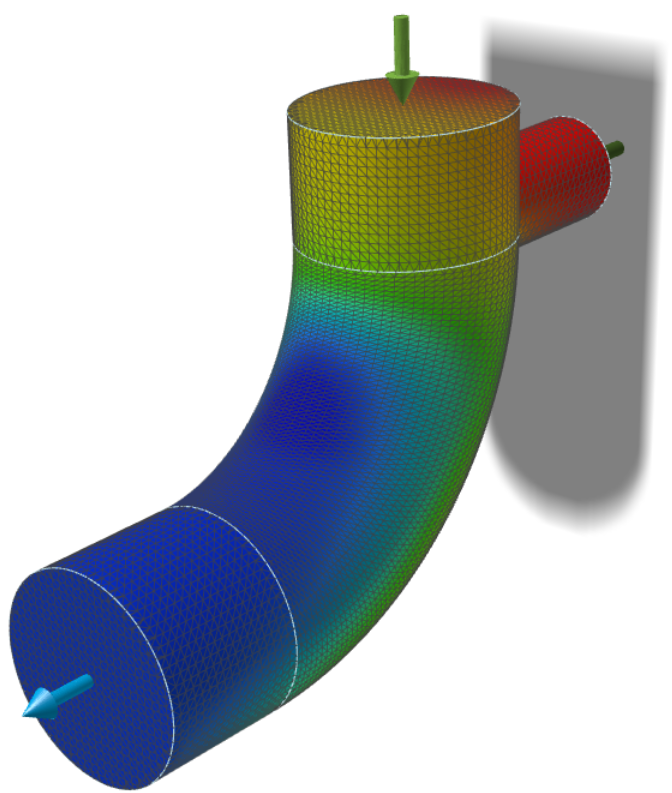
Show Fluids Results
View the results of a Fluids simulation in the Analysis Explorer.
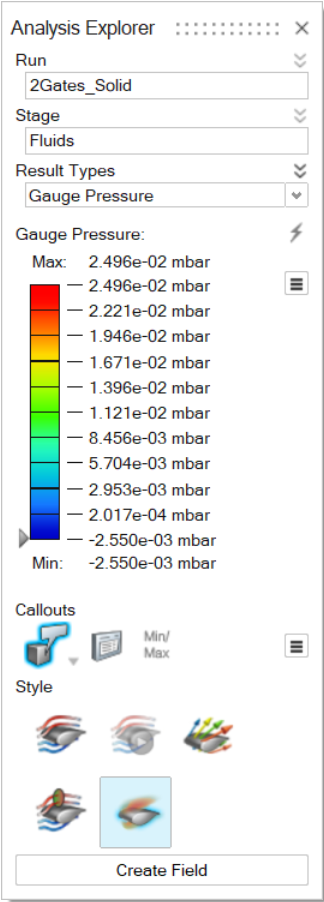
Analysis Explorer Options
The Analysis Explorer includes the following options.
Run
To delete a run from the Analysis Explorer, right-click the run name to select Delete Run.
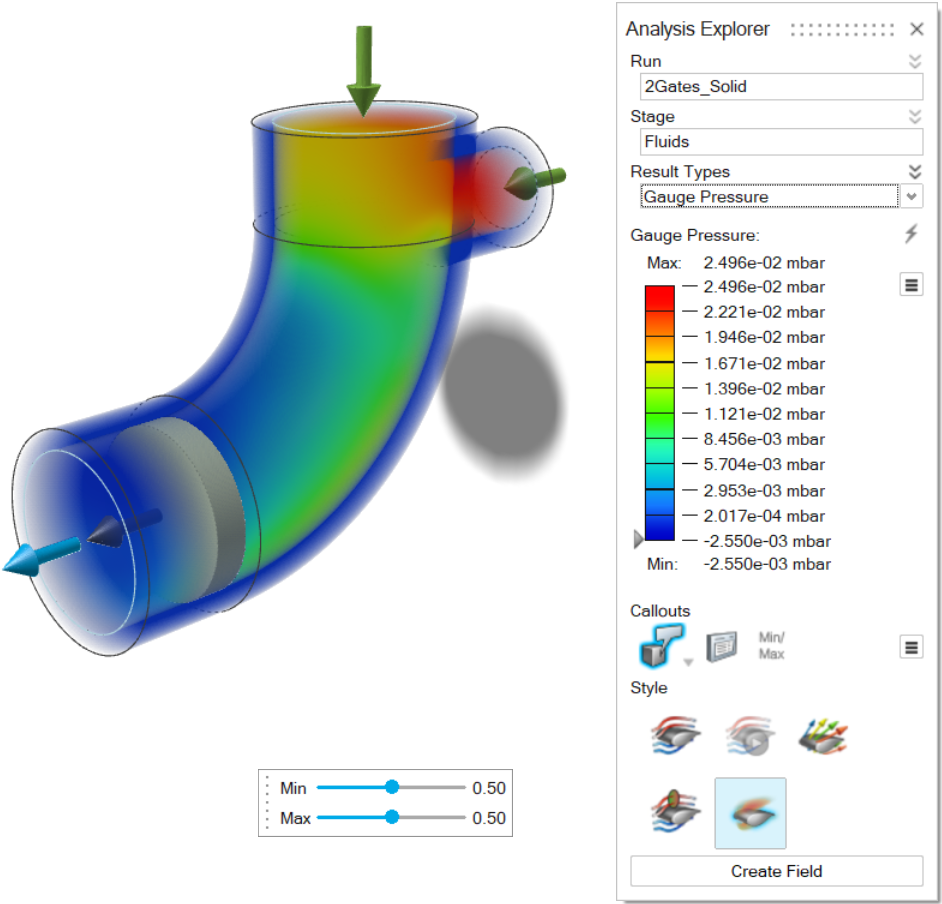
Result Types
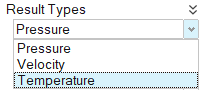
Gauge Pressure
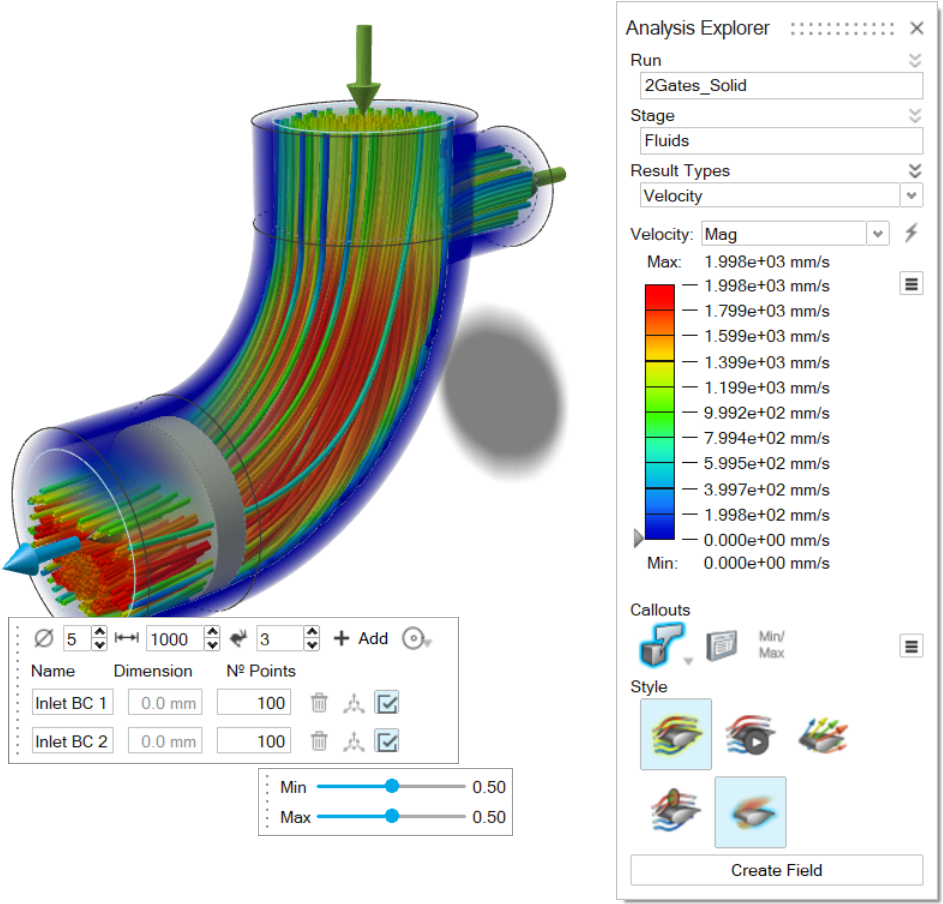
Velocity
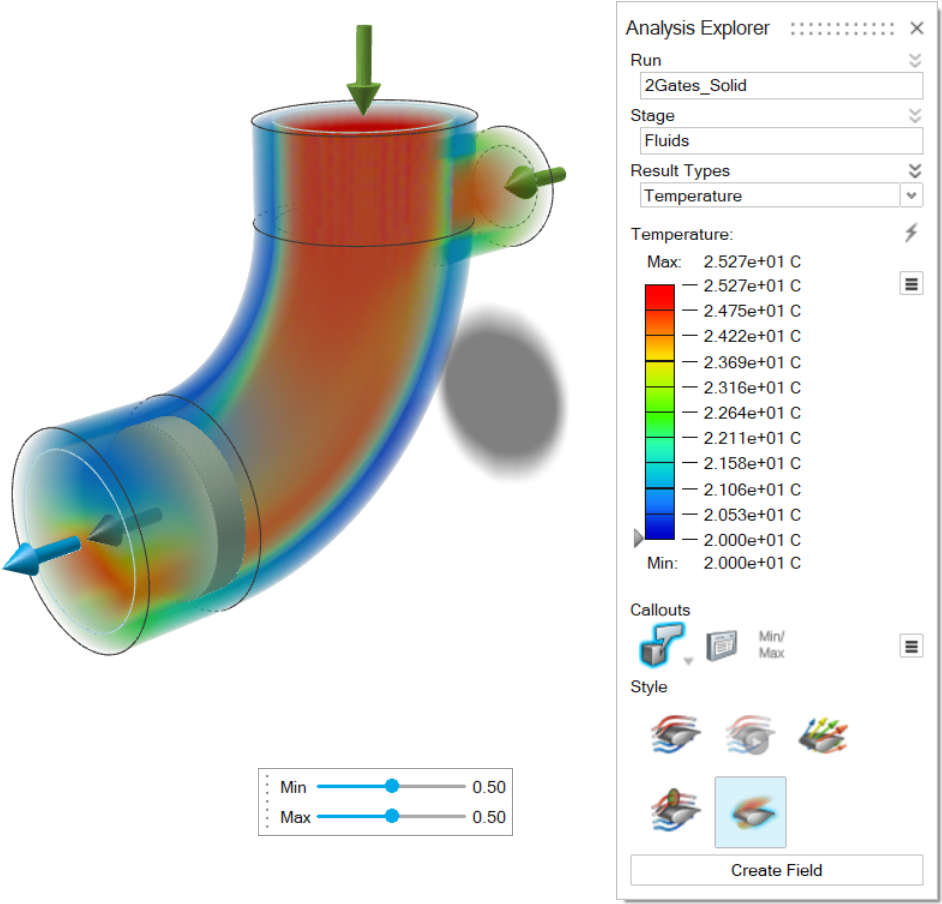
Temperature
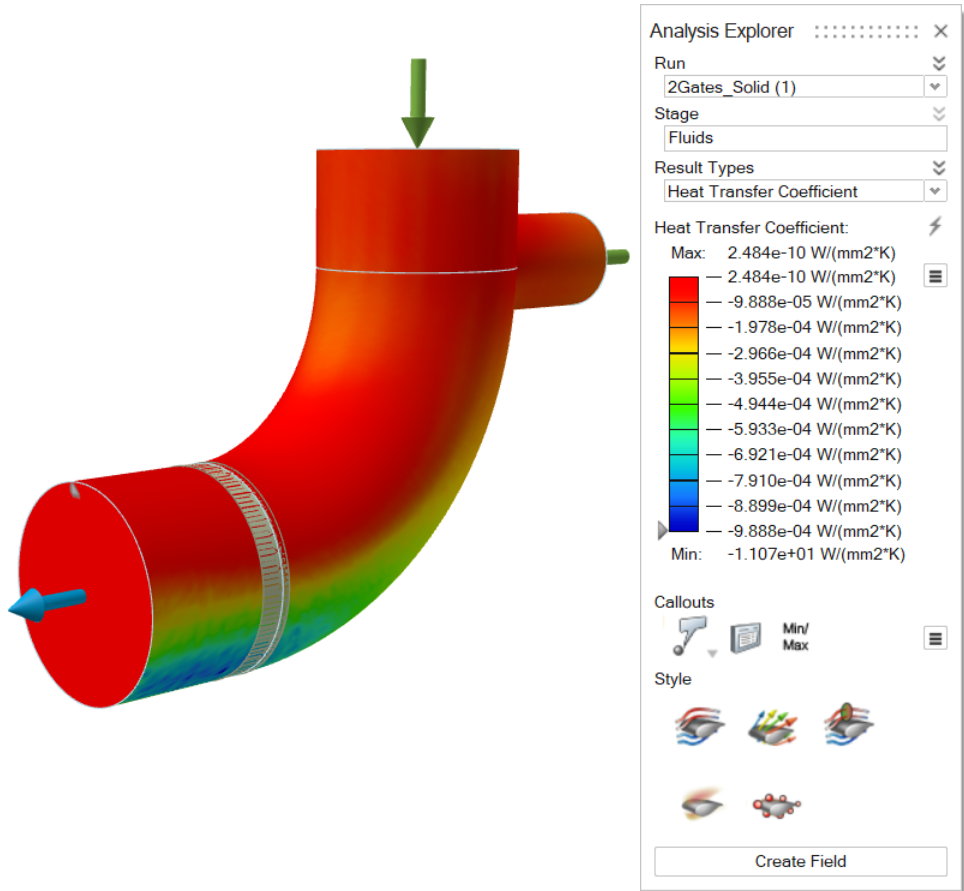
Heat Transfer Coefficient
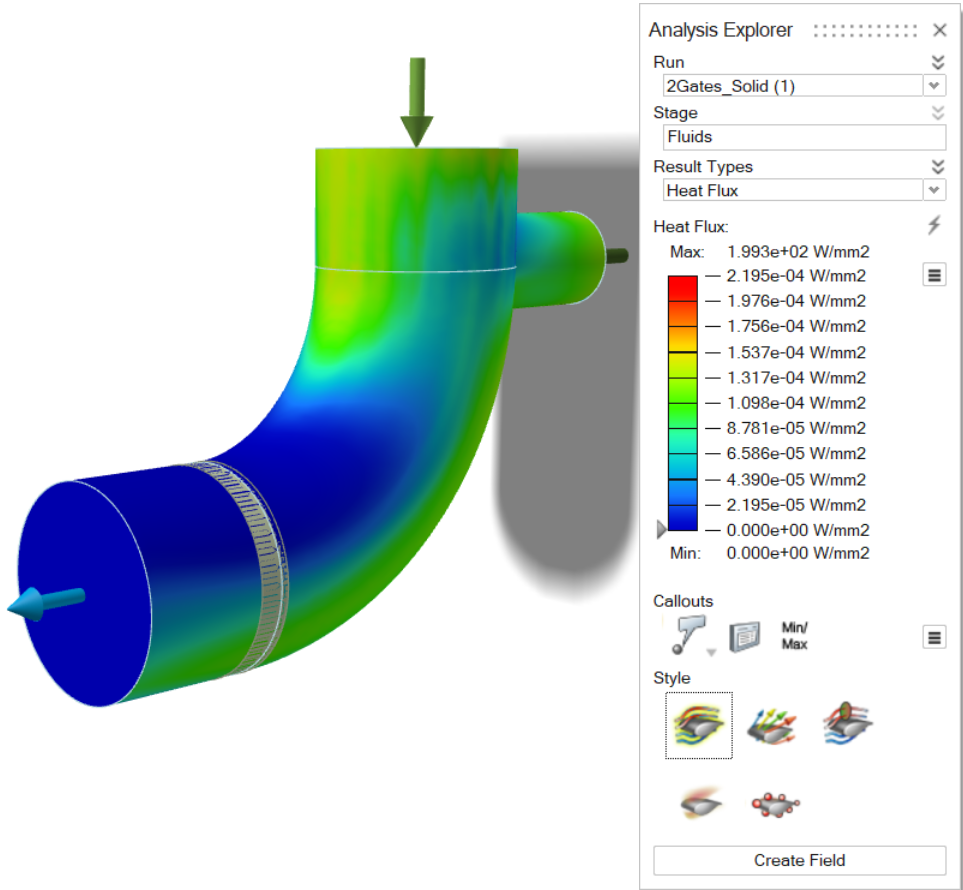
Heat Flux
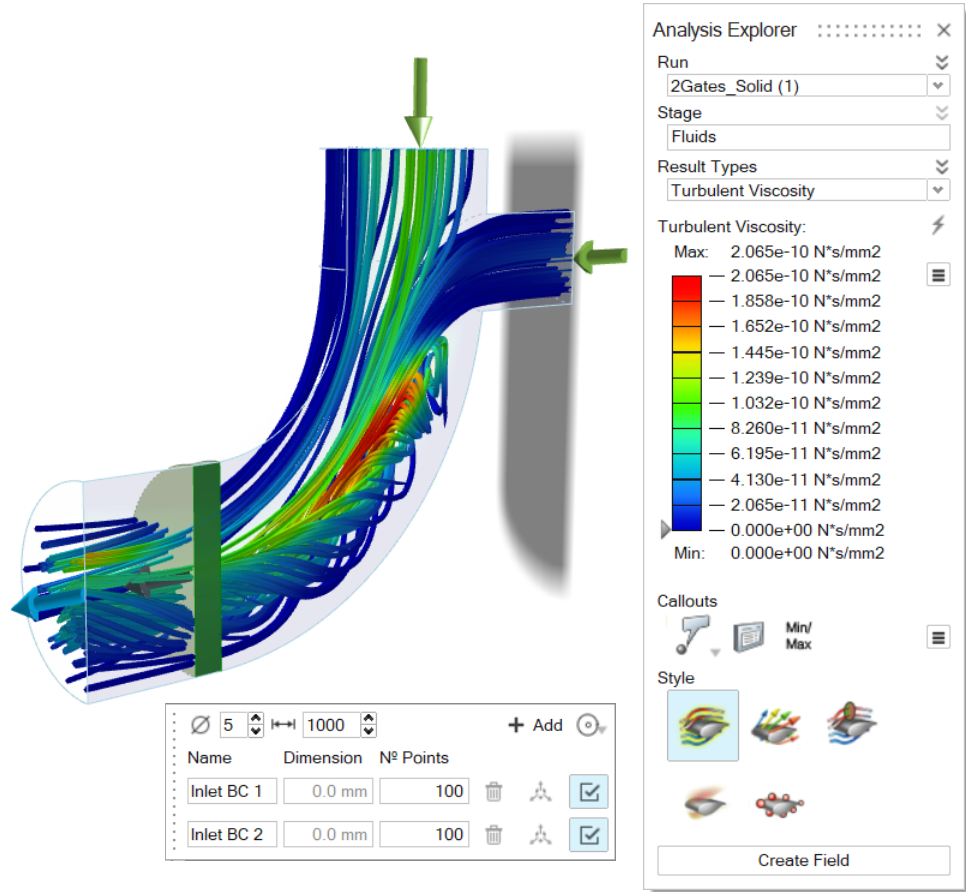
Turbulent Viscosity
Results Slider
| To | Do this |
|---|---|
| Change the upper or lower bound for the results slider | Click the bound and enter a new value. Click the  button to restore the default
values. button to restore the default
values. |
| Filter the results so that areas on the model with results greater than a specified value are masked | Click and drag the arrow on the results slider. To mask areas
with results less than the specified value, click |
| Change the legend color for the result type | Click the |
| Enable the legend's maximum and minimum values to change for each animation step | Click the |
| Reverse the default meaning of results slider colors Note: By default, red indicates high, green
indicates medium, and blue indicates low. |
Click the |
Show/Hide Elements
Callout Options
Add visual callouts to show points of interest on your analysis results.
| Option | Description | Note |
|---|---|---|
| Create, Show, and Hide Callouts |
Select to create callouts; select to show and hide callouts. |
Note: When transparency is enabled, callouts are
unsupported.
|
| List Callouts |
Display in a table all of the callouts that have been created, with the result types and values. Each callout is specific to the selected run and load case. |
|
| Min/Max Callouts |
Create a callout showing where the minimum/maximum value occurs for the selected result type. |
|
| Dynamic Callouts |
Display the results of various result types in existing callouts. | After creating a callout for a particular result type, click the
|
 button to filter by cell
value.
button to filter by cell
value.

Style Options
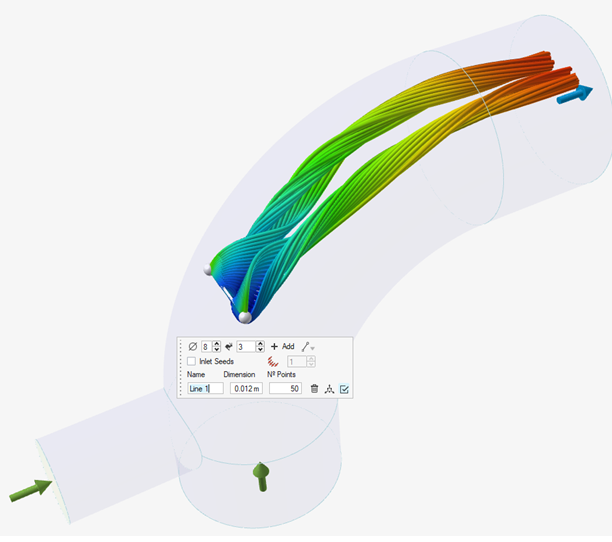
Visualize the results as static streamlines, animated streamlines, or vectors. You can also make edits to the streamlines or vectors.
| Option | Description | Microdialog Options |
|---|---|---|
| Static Streamlines |
Visualize the results as static streamlines.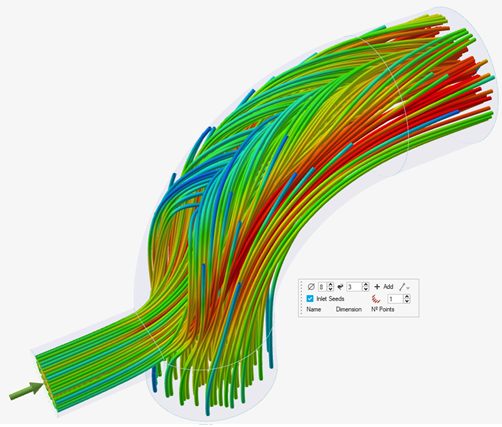
|
To access the microdialog options for streamlines, select the
Static Streamline icon
|
| Animated Streamlines |
Only available if Streamlines is turned
on. Click the icon once to visualize the results as animated streamlines. Click the icon again to jump to the end of the animation. 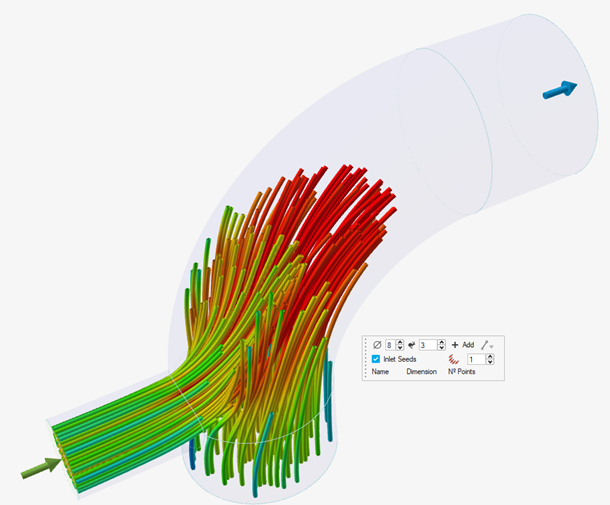
|
|
| Vectors |
Visualize the results as vectors.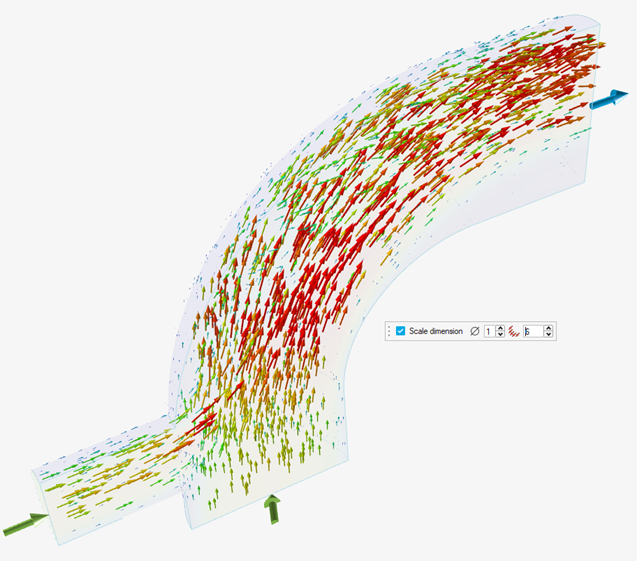
|
To access the microdialog options for vectors, select the
Vectors icon 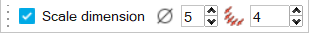
Use the microdialog options to edit the vectors:
|
| Integration Sections |
Visualize average velocity/flow rate through a section of the fluid
domain. 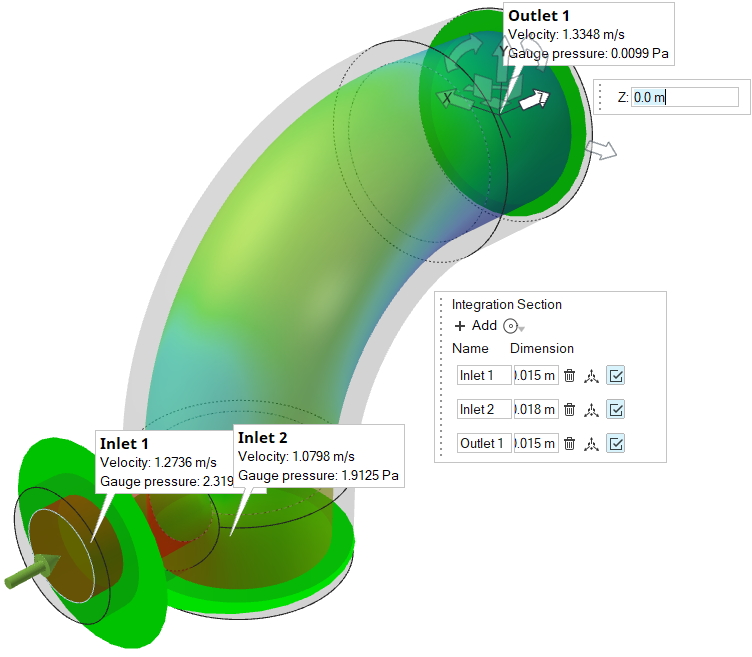 |
To access the microdialog options for Integration Sections, select
the Integration Sections icon 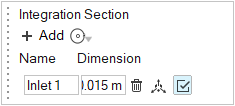 Use the microdialog options to create and edit sections. 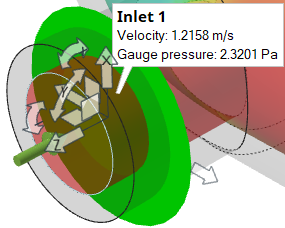 Use the move tool to translate, rotate, and resize sections. |
| Enable Transparency
|
Render the model transparent to a greater or lesser degree. This is
useful when observing the interior of a model in full three-dimensional
view without using section cuts. |
Use the sliders in the microdialog to change the transparency of the
minimum and maximum areas the current result type. |
| Particle Visualization |
Visualize the results as particles.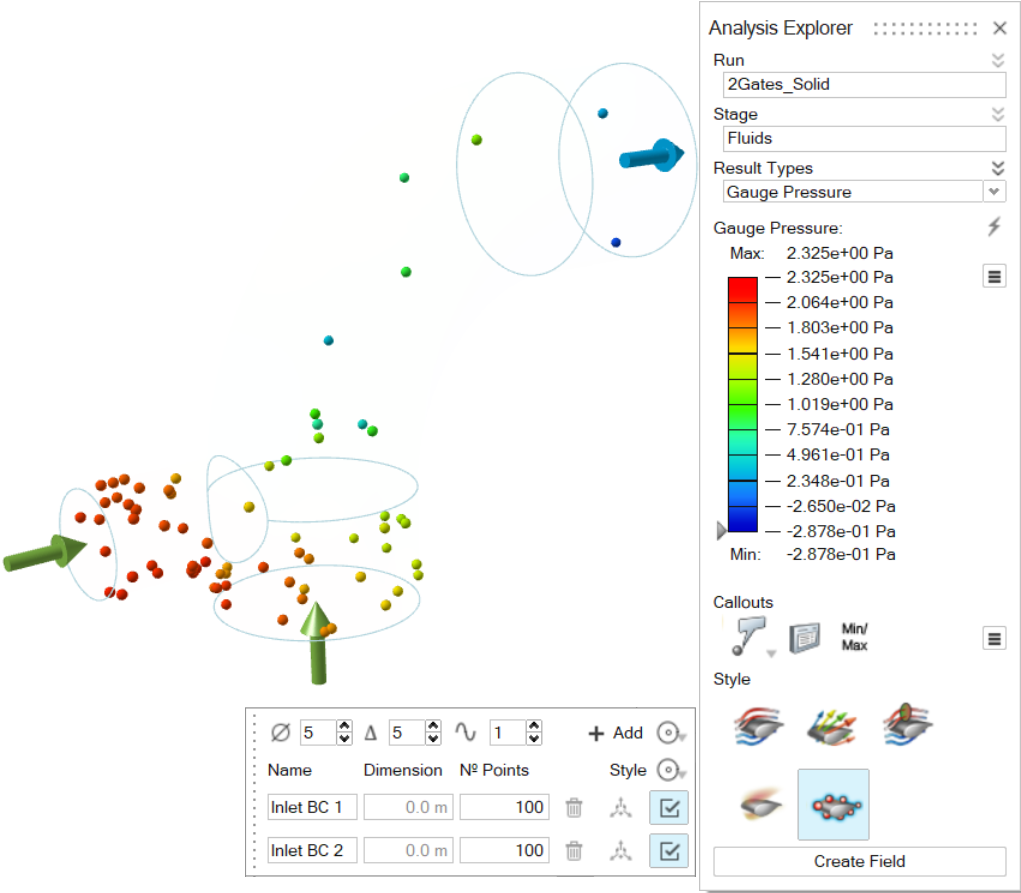 |
To access the microdialog options for particle visualization, select
the Particle Visualization icon 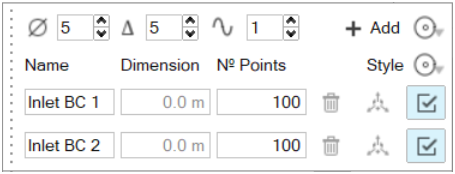
|
Create Field
Create an implicit field from the results of an analysis run. The Create Field button is located at the bottom of the Analysis Explorer.
-
Click the Show Analysis Results
tool on the Analyze icon to open the Analysis Explorer.

Note: Only OptiStruct results are supported in direct implicit field creation. For SimSolid results, see Video Tutorial: Field-Driven Design in Inspire Implicit Modeling.Tip: To find and open a tool, press Ctrl+F. For more information, see Find and Search for Tools.
- Use the Analysis Explorer dialog to select the results to convert to an implicit field.
-
Click the Create Field button located at the bottom of
the Analysis Explorer.

For more information, see Create Implicit Fields from Analysis Results. -
If an implicit part exists, a dialog will ask whether to create a new implicit
part or add the field to an existing implicit part.

- Click New to create a new implicit part in the Model Browser and Construction History. The new part will only contain the new field(s) using simulation data.
- Click Existing to select an implicit part in the model. The new fields are created at the current point in the history timeline.