View Convergence Plots and Tables
Monitor the convergence of engineering quantities and Equation residuals.
- Run a Fluids simulation.
-
While the simulation is running, on the Fluids ribbon, select the
View Convergence Plot tool in the
Analyze tool group.

Tip: To find and open a tool, press Ctrl+F. For more information, see Find and Search for Tools.The Convergence Plot window appears.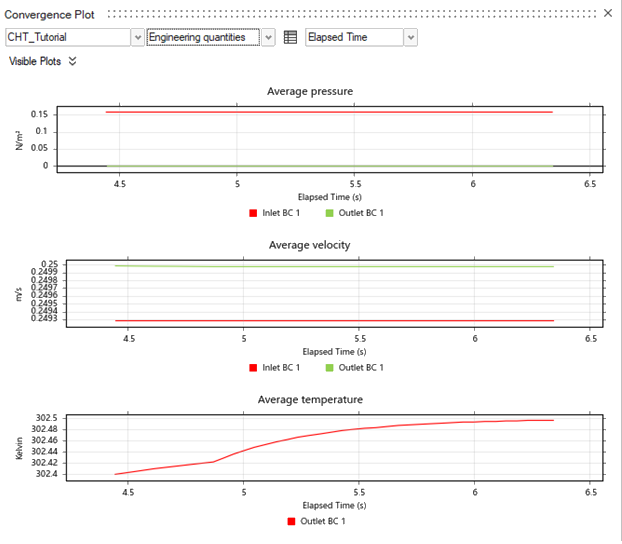
- Select to display Engineering quantities (default) or Numerical convergence results.
-
To view Engineering quantities options, select
Engineering quantities from the dropdown menu.
To Do this Select which convergence plots to view - Select
 next to
Visible Plots, then enable
or disable the following switches:
next to
Visible Plots, then enable
or disable the following switches:- Average pressure
- Average velocity
- Flow fraction
- Uniformity velocity
Display the convergence data in a table - Click the Show Convergence
Table icon
 . The data in the
Convergence Plot window
will display as a table in the modeling
window.
. The data in the
Convergence Plot window
will display as a table in the modeling
window.
Plot results over time (Seconds) Select Seconds from the dropdown menu. Plot results over the Number of iterations Select Number of iterations from the dropdown menu. Access convergence plot ASCII text files Open the run folder, then navigate to the surface_monitors folder. - Select
-
To view Numerical convergence options, select
Numerical convergence from the dropdown menu.
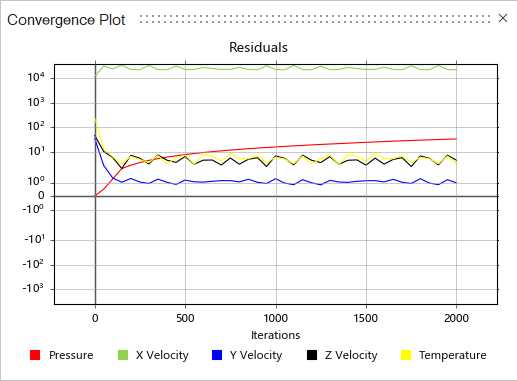
The equation residuals from the analysis appear.
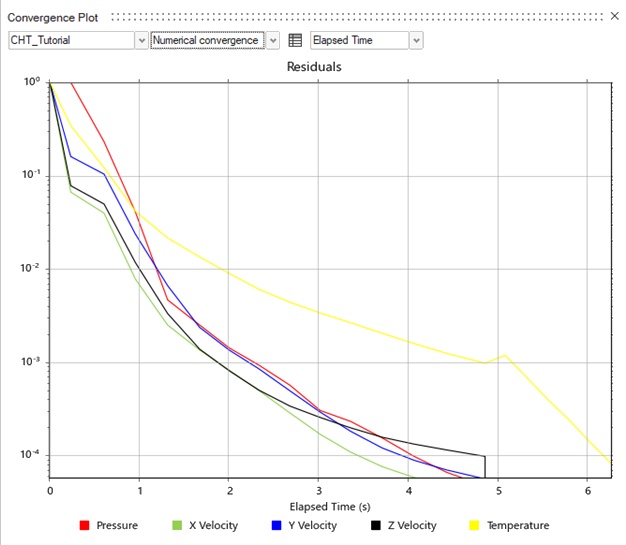
To Do this Plot results over time (Seconds) Select Seconds from the dropdown menu. Plot results over the Number of iterations Select Number of iterations from the dropdown menu. Tip:- When the Numerical convergence curves drop below 1.e-4, you can stop the simulation in advance to review the results.
- If the Numerical convergence curves go up and down sharply, review
and modify the model setup and run a new simulation to produce valid
results.