Report Chart
View the generated report chart and download it in the CSV format.
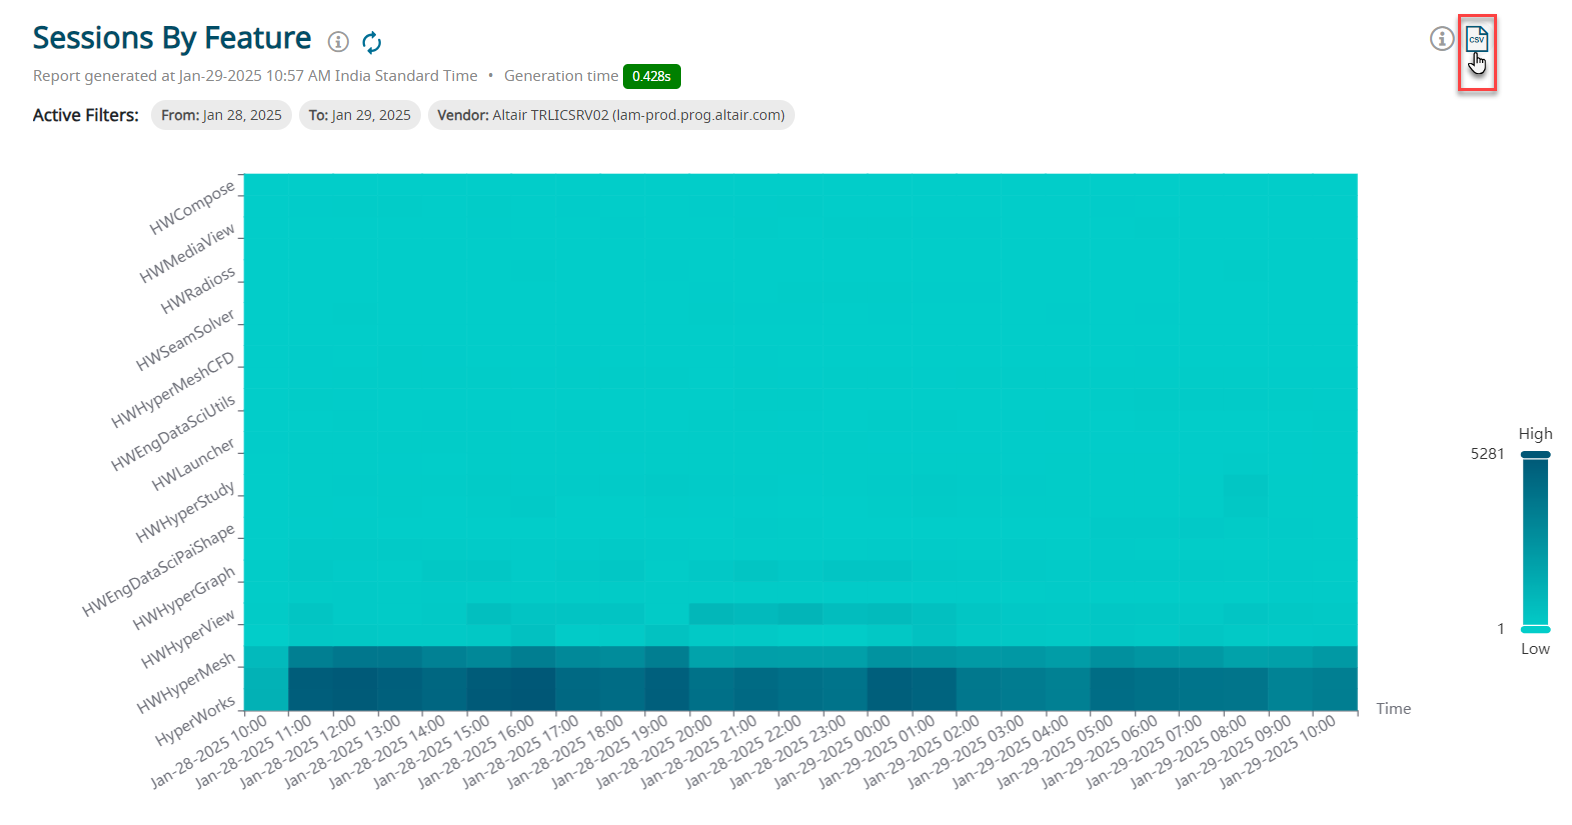
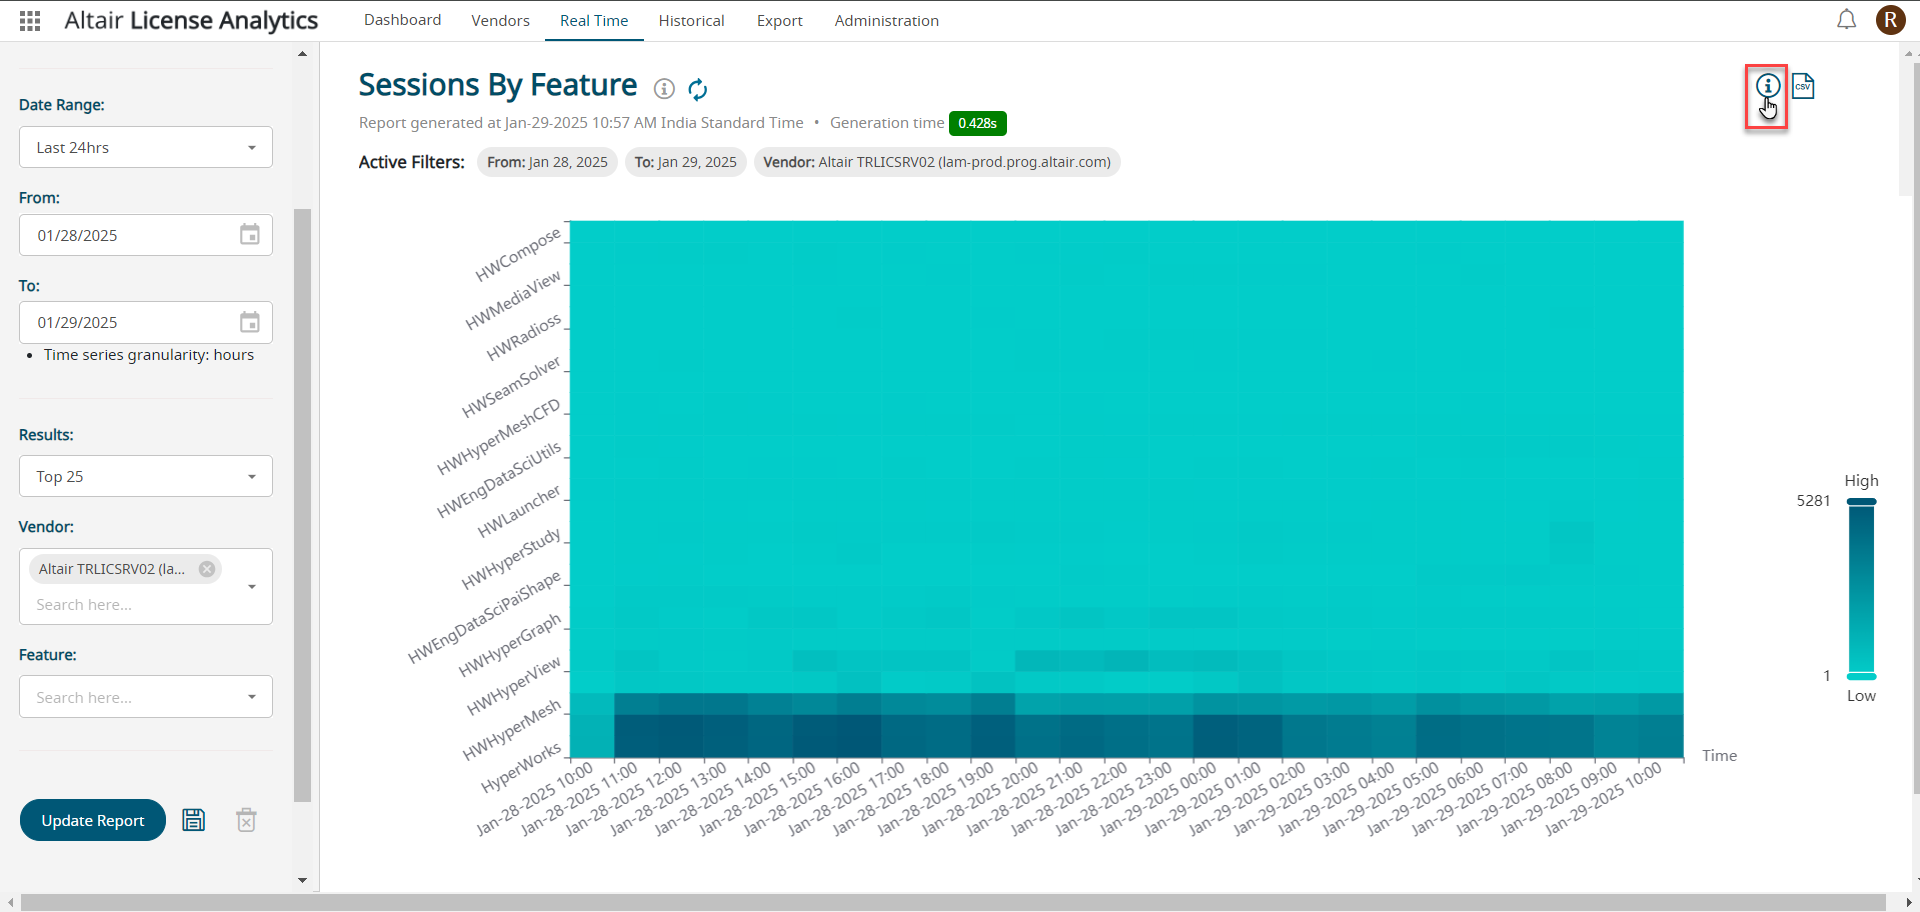
The report chart is generated based on the report that is selected and with the
filters that are applied.Figure 1. Report Chart
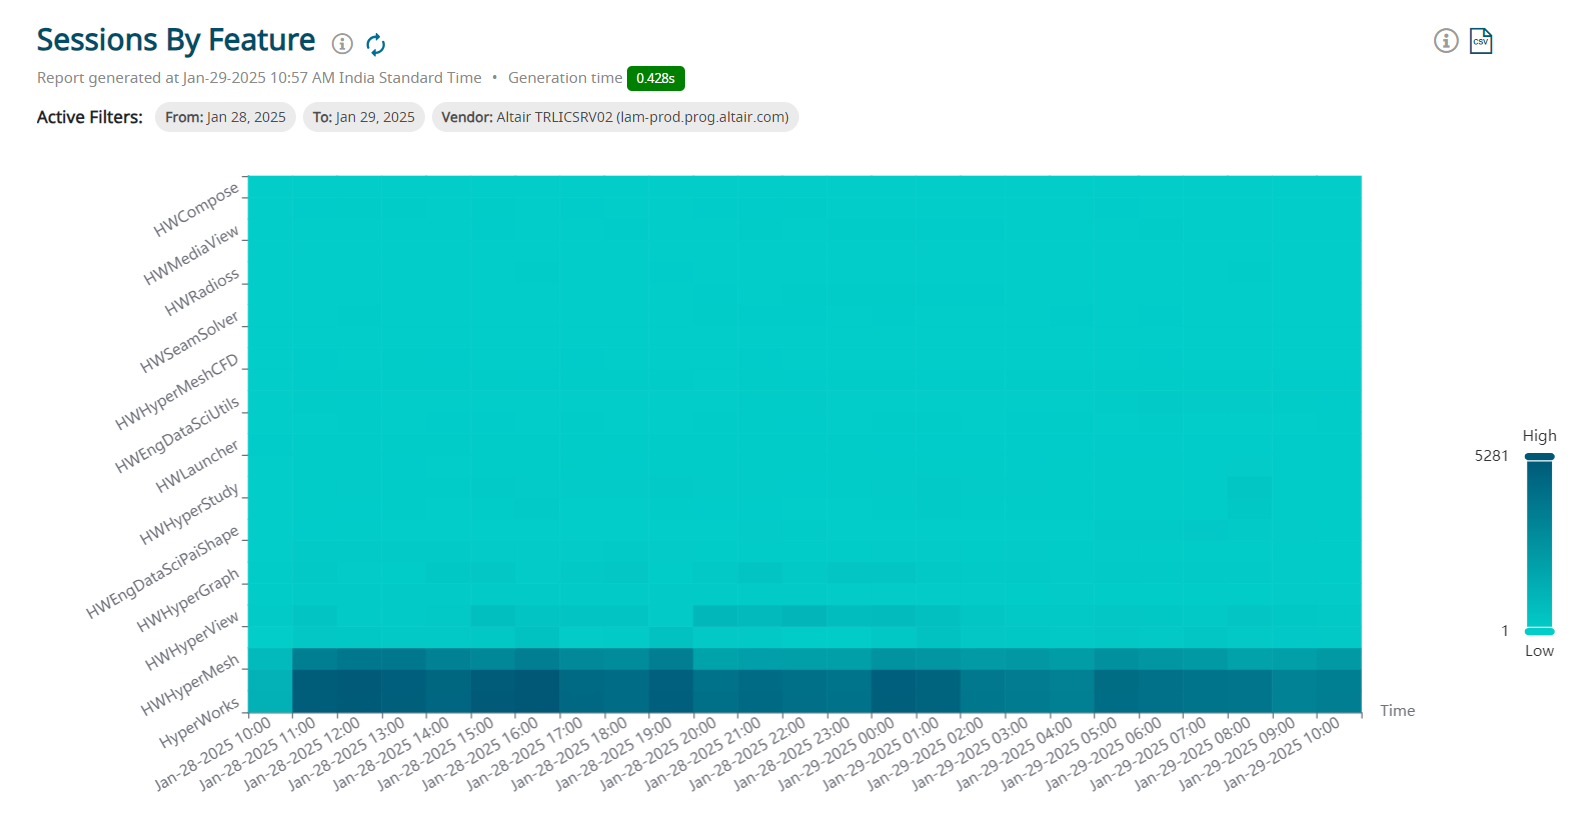
In this example, Session By Feature report is selected which represents the Date and Time in the X-axis and the report metrics in the Y-axis.
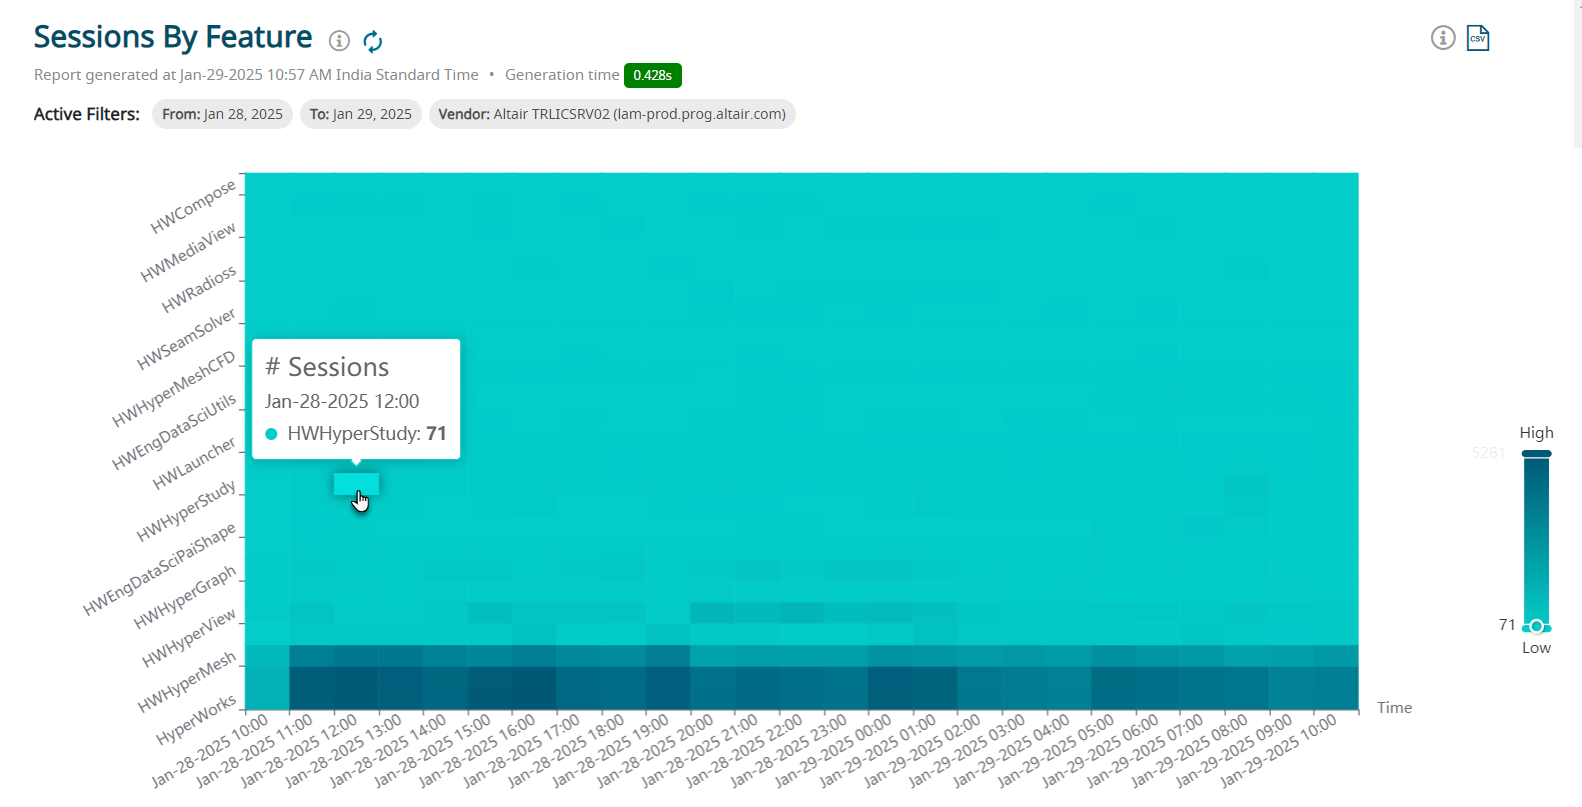
Mouse-hover the chart to view the details.Figure 2. Chart Information
Click ![]() next to the report name to view the information of this
report.
next to the report name to view the information of this
report.
Click ![]() next to the report to refresh the report.
next to the report to refresh the report.
You can perform the following actions:
- View the chart based on the color scheme
- View the chart query
- Download the chart in the CSV format
Chart Color
The chart color scheme is displayed at the side of the chart providing the session by
feature from Low to High.Figure 3. Chart Color Scheme
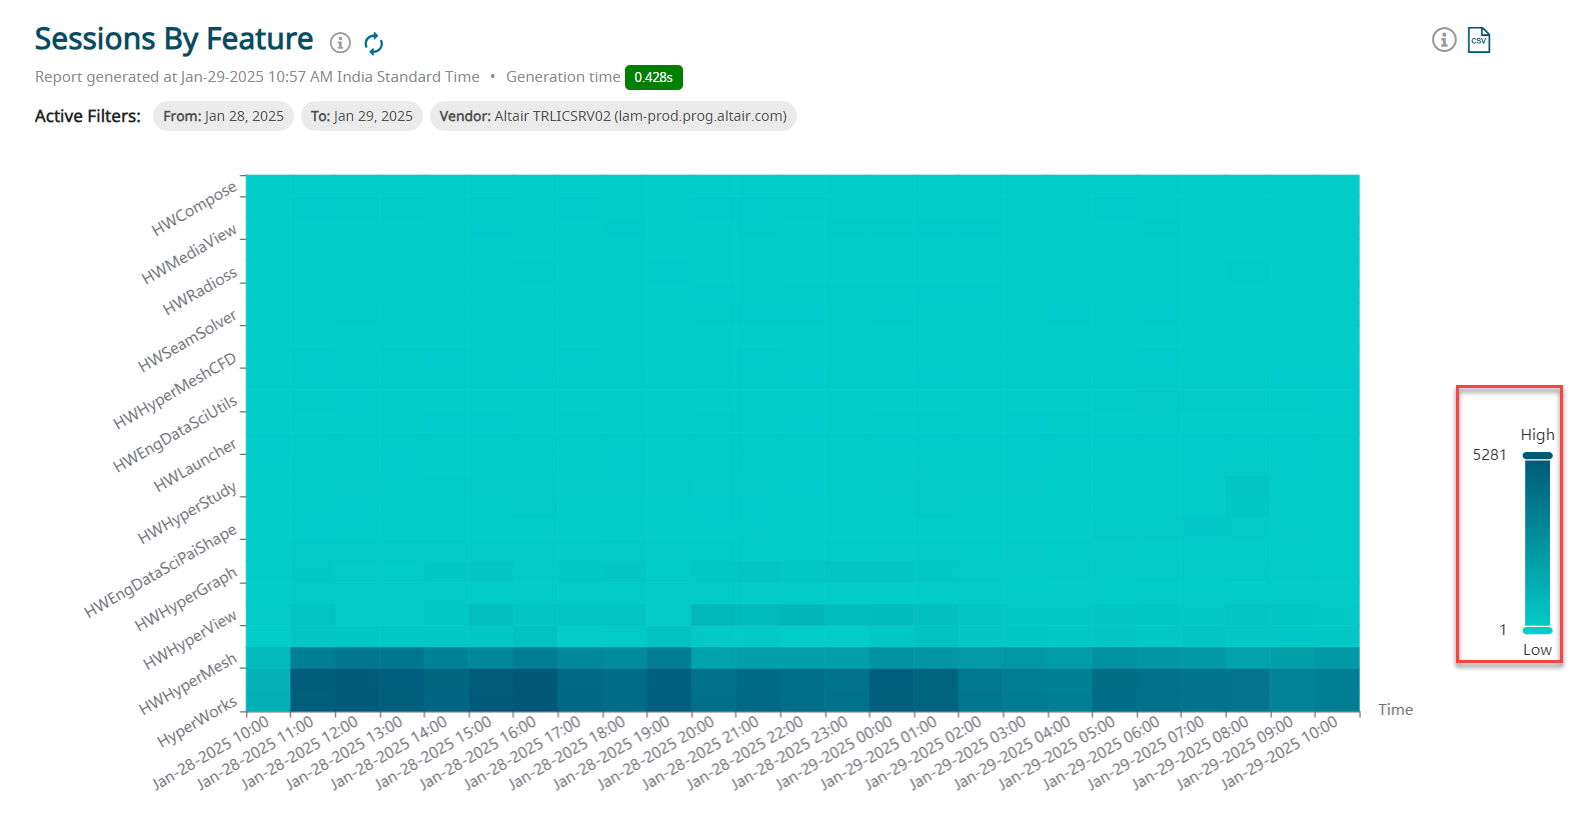
The chart will highlight the details when you mouse hover the color scheme.Figure 4. Chart Color Scheme - Highlight

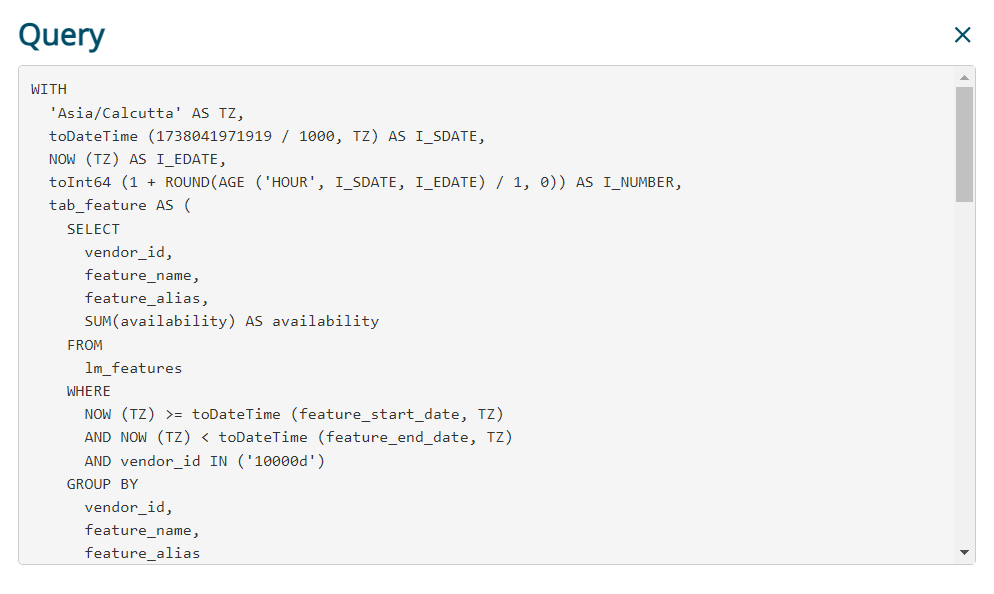
View the Chart Query
Note: Enable debug query in the Administration tab to view the
chart query.
Click  to view the query that is used to generate the
report.
to view the query that is used to generate the
report.Figure 5. Chart Query Information
The Query that is used to generate the report is displayed.Figure 6. Chart Query
Download the Report Chart
Click  to download the chart in the CSV format.
Figure 7. Download Chart