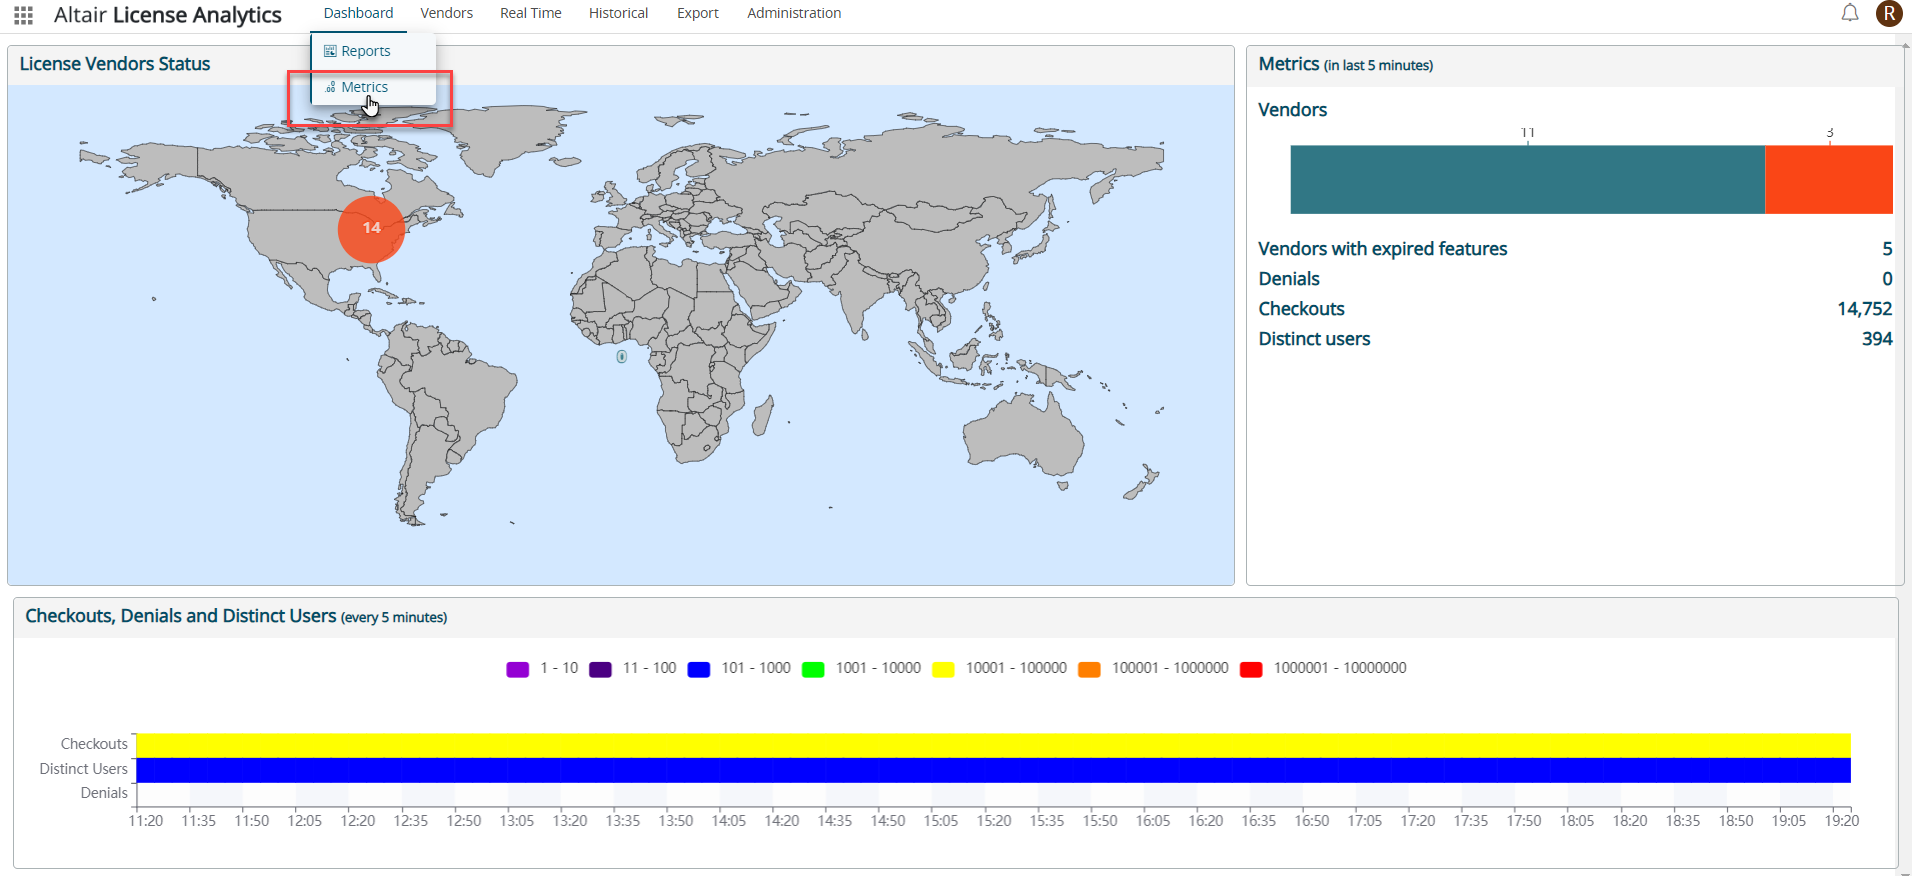
Click Dashboard > Metrics to open the metrics dashboard.
Figure 1. Metrics Dashboard
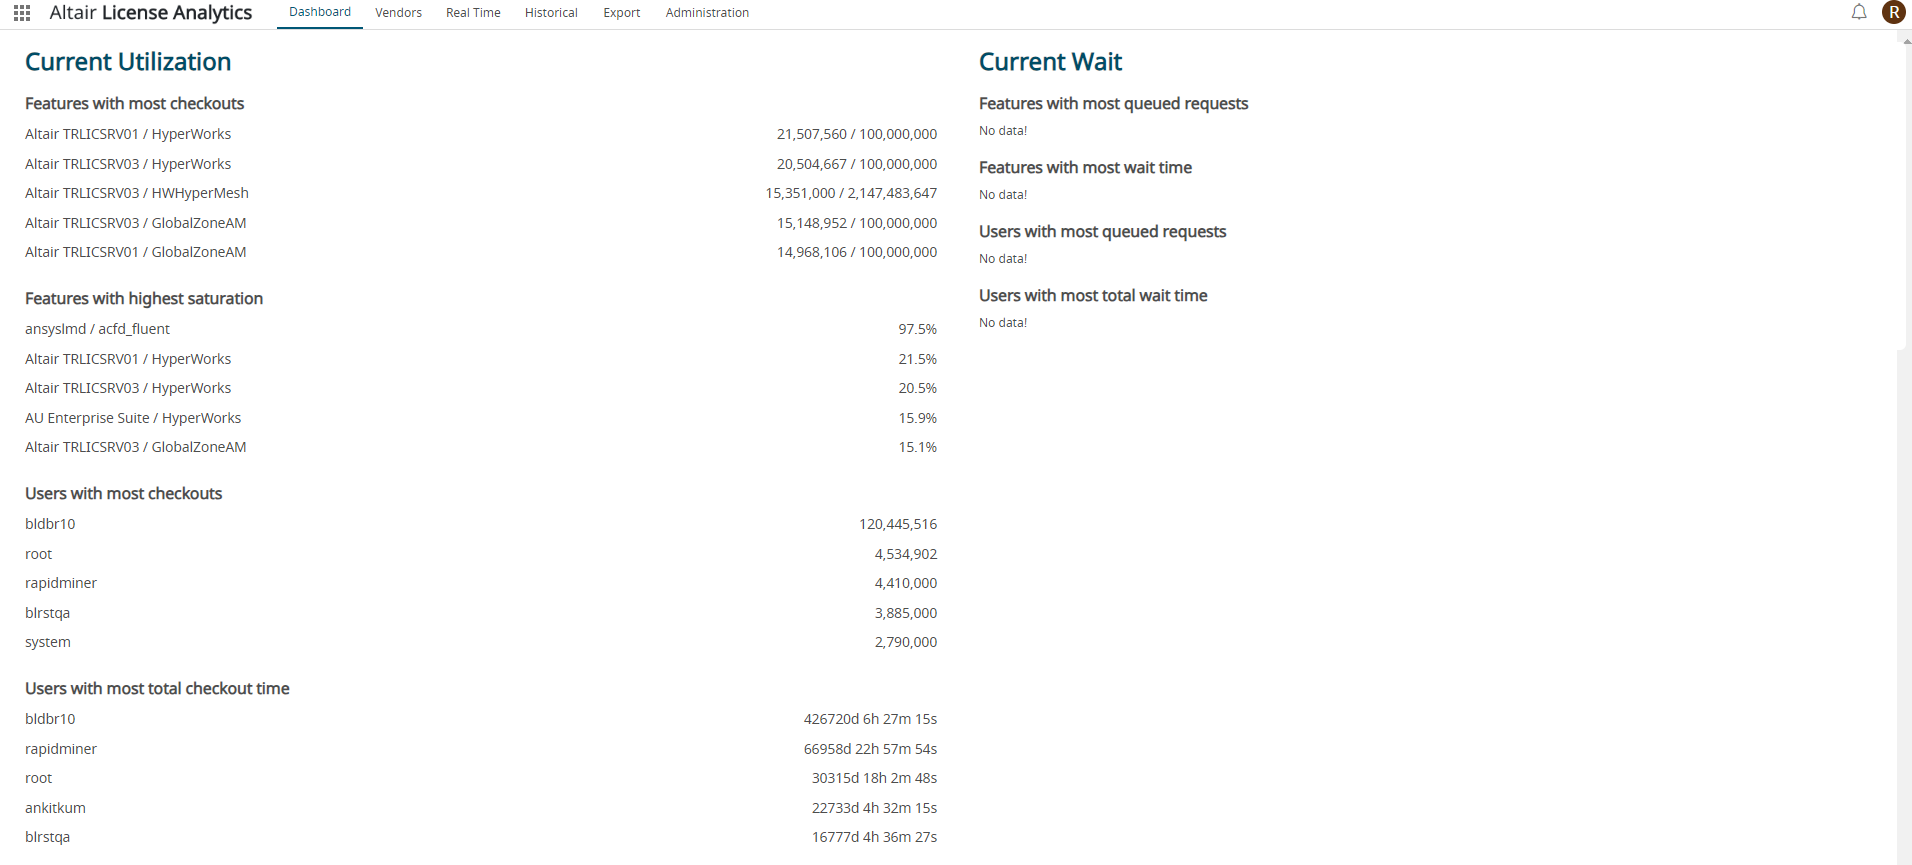
The metrics data is displayed:Figure 2. Metrics Data
Current Utilization
Utilization can be monitored through the features with the most checkouts, features
with the highest saturation, users with most checkouts and users with most total
checkout time.
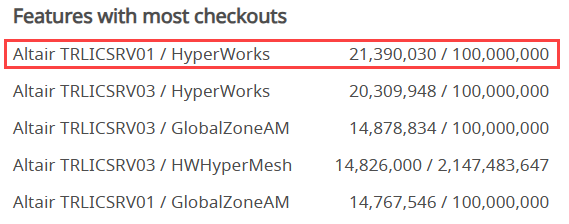
Features with the most checkouts
Figure 3. Features with the most checkoutsIn this example, HyperWorks has the most checkouts in Altair TRLICSRV01 with
21,472,630 of 100,000,000
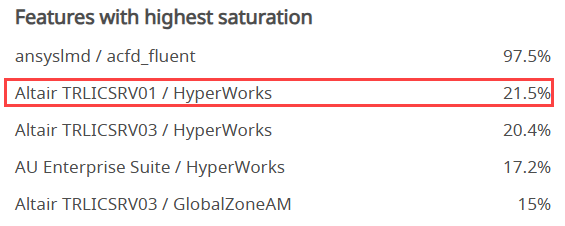
Features with the highest saturation
Figure 4. Features with the highest saturationIn this example, HyperWorks is using 21.5% of the available capacity
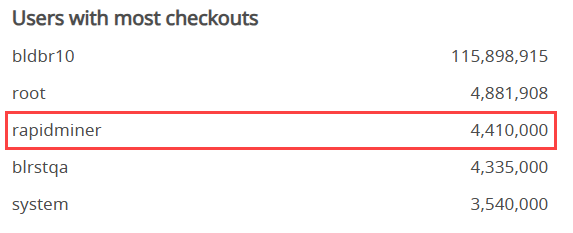
Users with the most checkouts
Figure 5. Users with the most checkoutsIn this example, rapidminer has 4,410,00 license checkouts
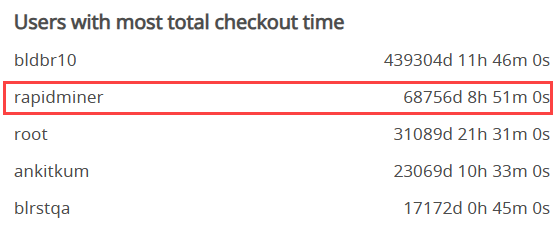
Users with the most total checkout time
Figure 6. Users with the most total checkout timeIn this example, rapidminer checkout time of 66958 days, 22 hours, 57 minutes
and 54 seconds.