Reports Dashboard
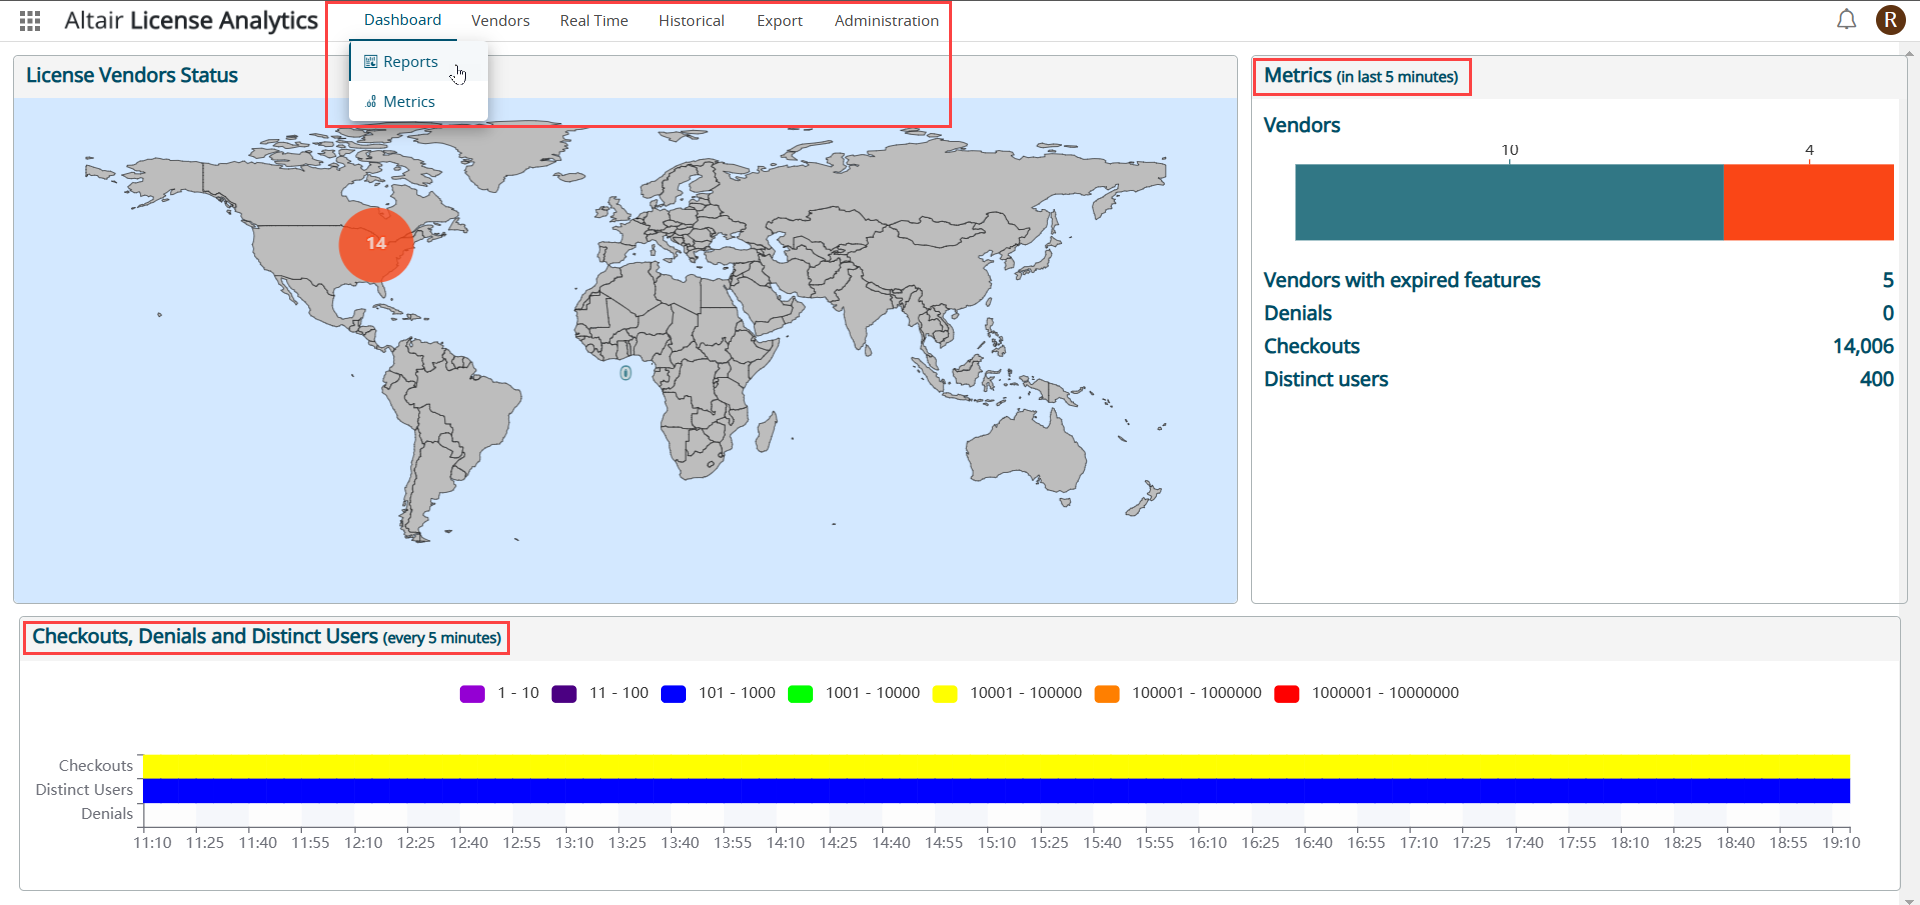
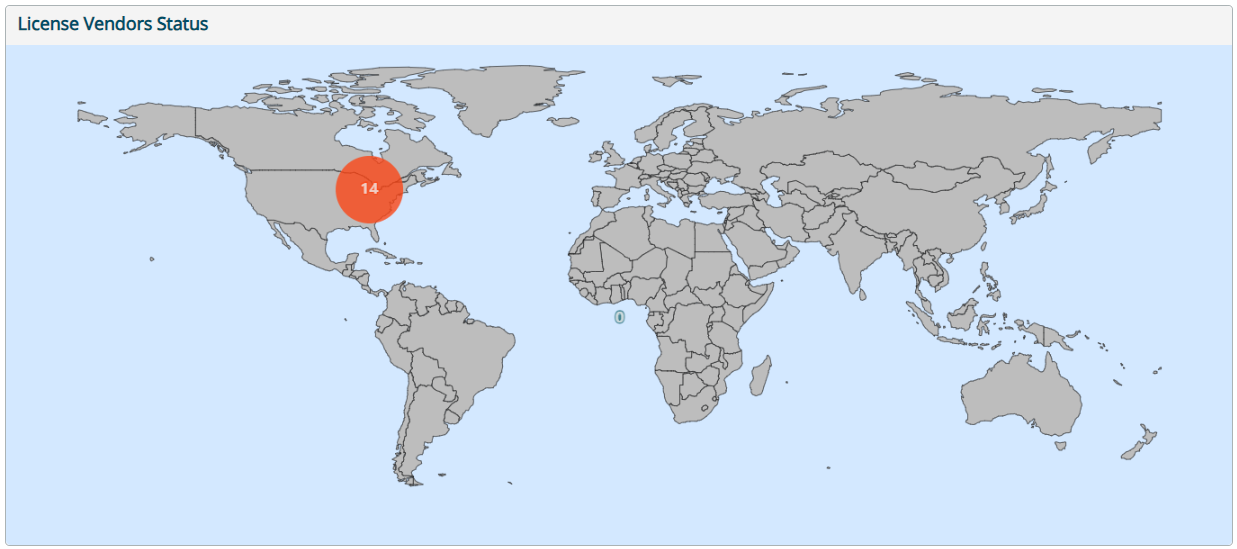
License Vendors Status
The License Vendors Status report uses circles of different sizes on the world map
to represent number of vendors distributed in countries across the world.
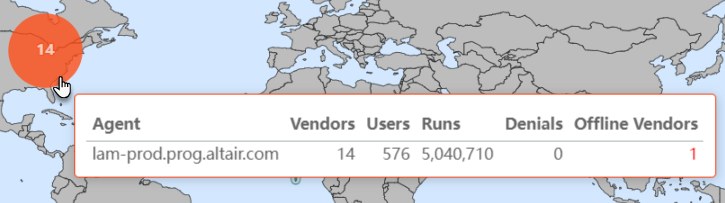
Hover over the circle to view the agent, number of vendors, users, runs, denials and
offline vendors.
- When you hover over an area, the name of the country is displayed.
- Move the mouse wheel to zoom in or out of the map.
- Drag to pan the map.
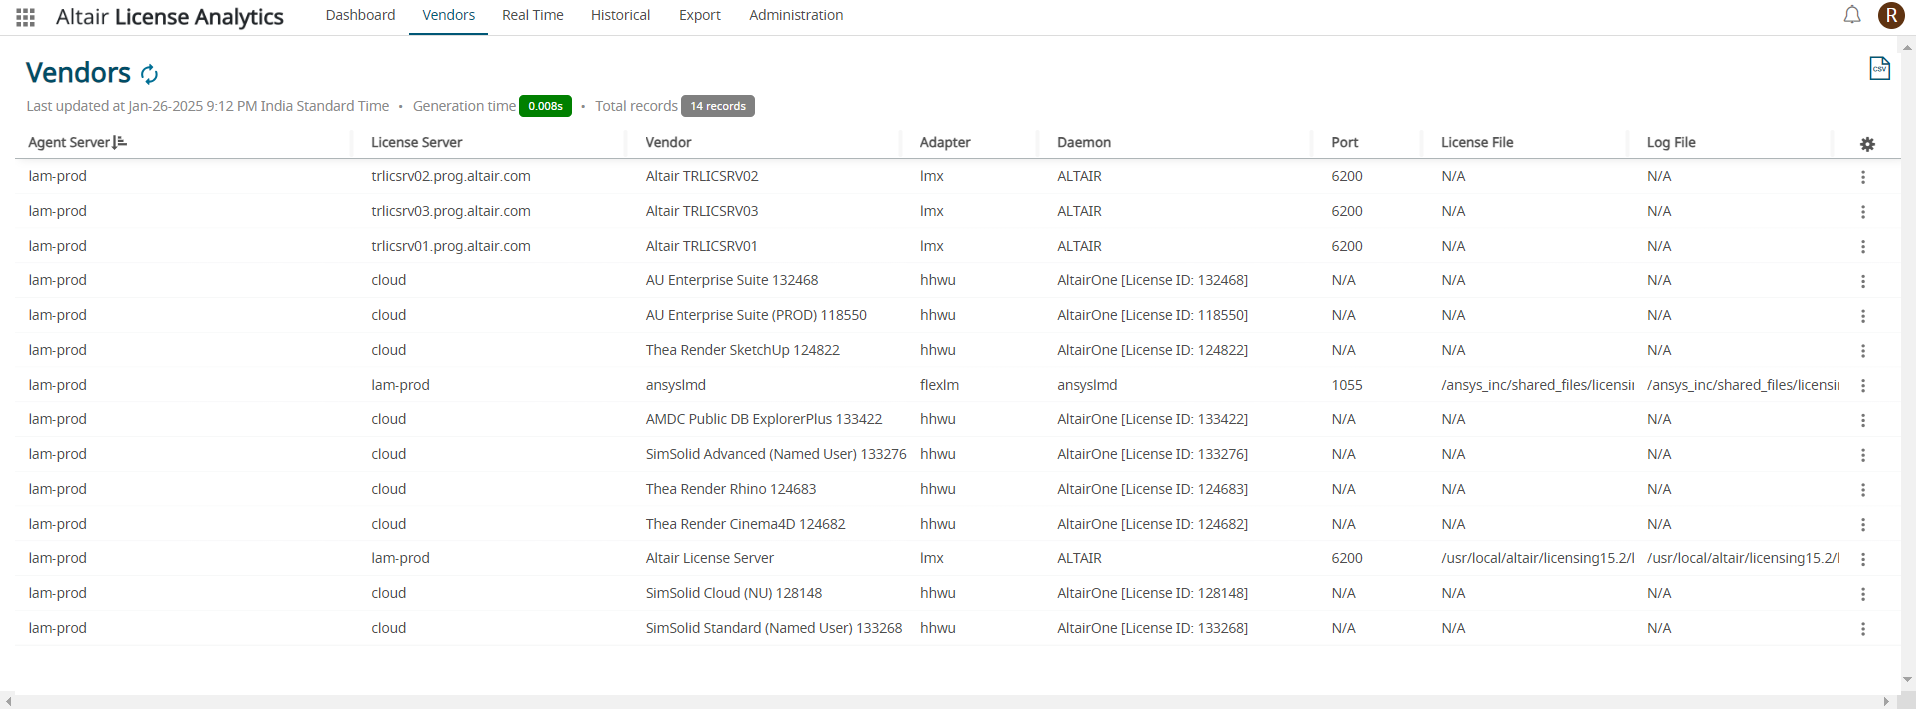
- Click on any country in the map to open the Vendors module.
Metrics (in the last 5 minutes)
This report displays the number of online and offline vendors in the last five
minutes.
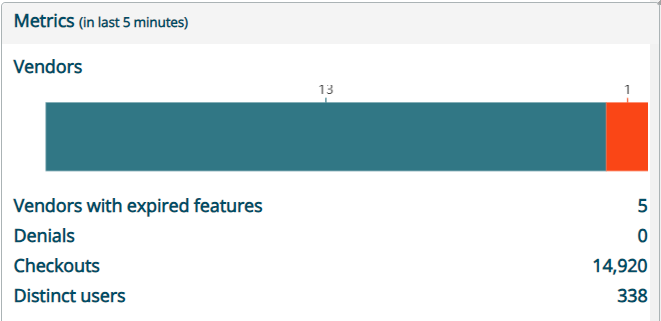
It also displays the following data for the last five minutes:
- Vendors with expired features
- Denials
- Checkouts
- Distinct users
Checkouts, Denials, and Distinct Users (every 5 minutes)
This report displaysthe number of checkouts, denials and distinct users information for the last eight hours in intervals of 15 minutes.
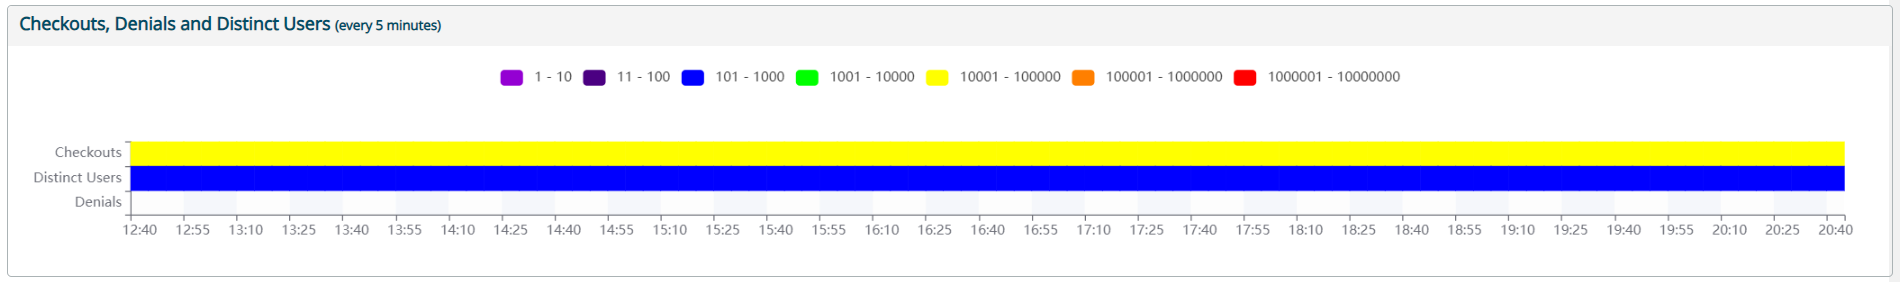
In the 15 minutes range it displays a unique color for the number of checkouts, distinct users,and denials.
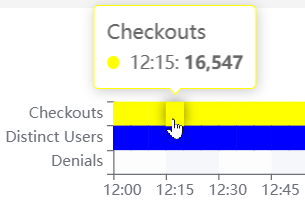
- Hover over the chart to view checkouts for a specific time interval.
- Click the legend of the chart to hide and show the data.