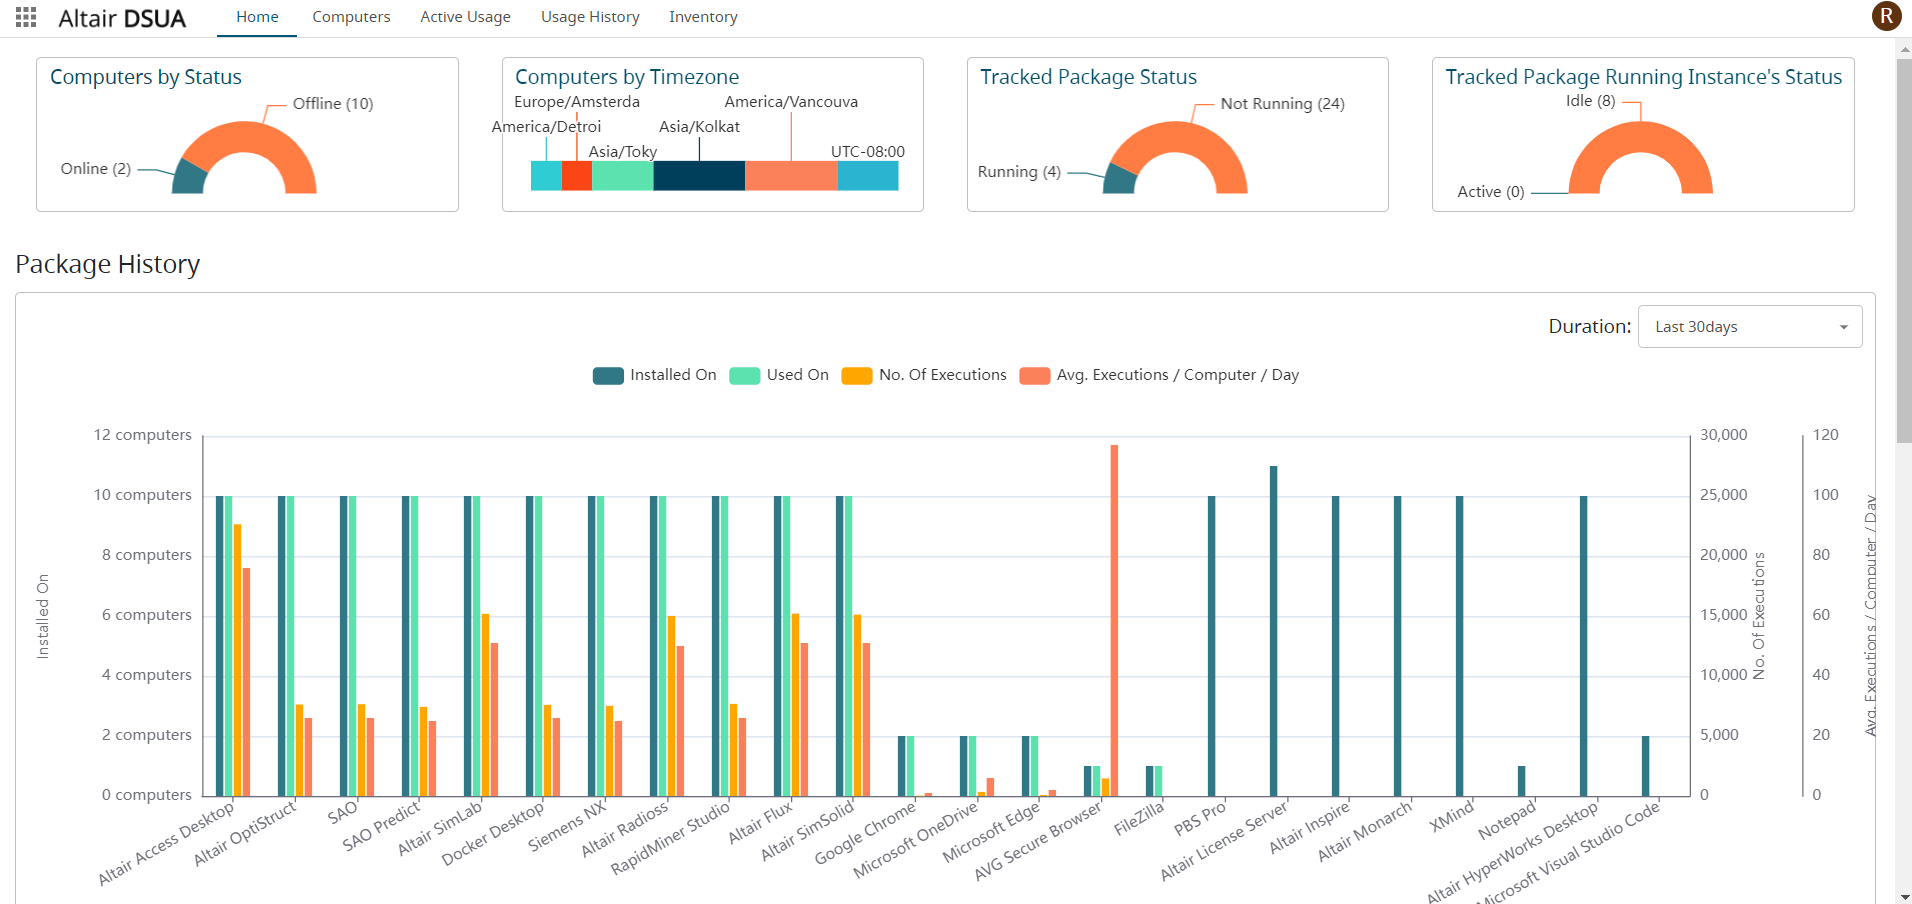
DSUA Dashboard
DSUA dashboard provides the computer status, computer by timezone, package status, package running status, package history, and package usage.
Follow the DSUA Workflow so that computer and package information is populated in the Dashboard.
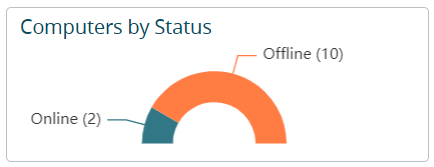
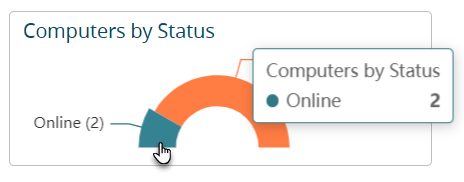
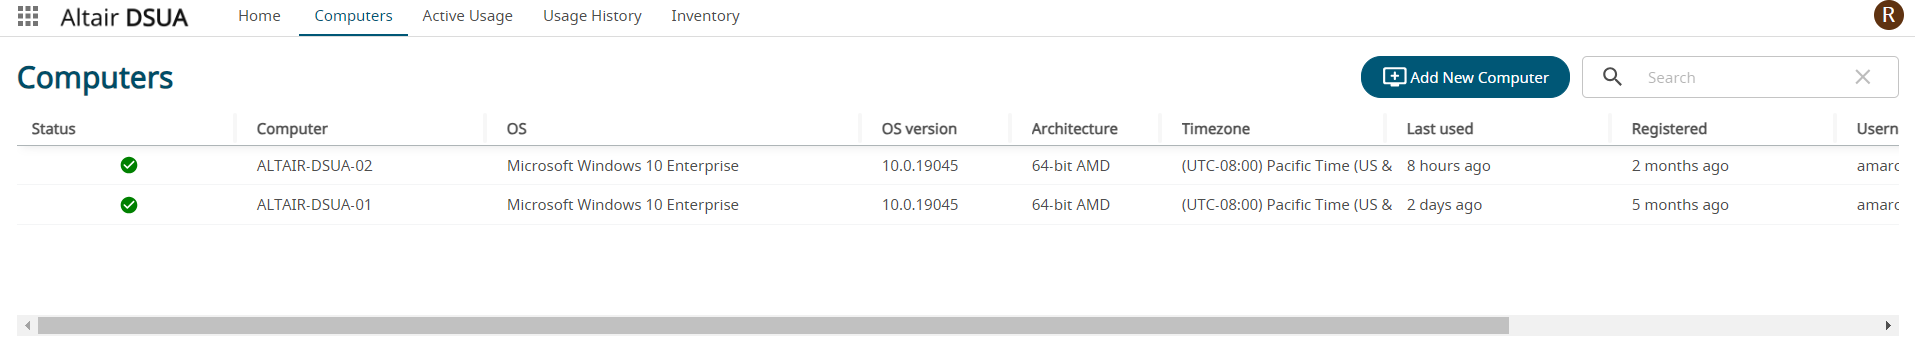
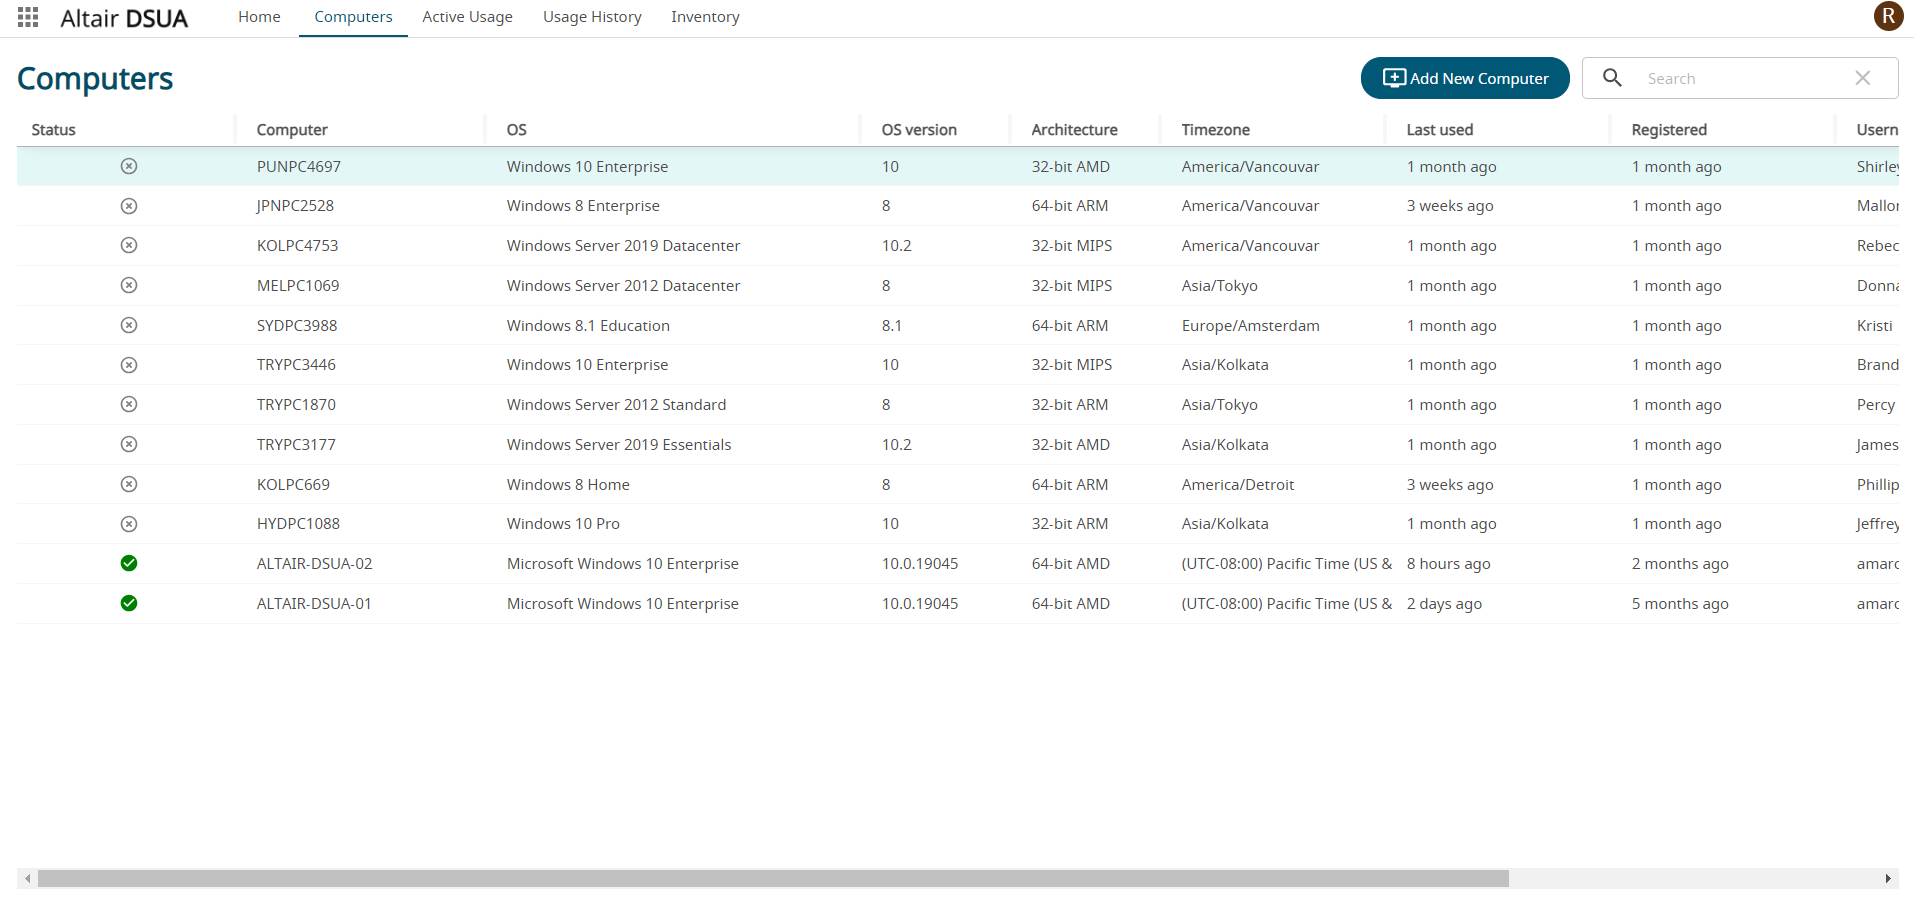
Computer Status
Provides the status of the computers that are offline and online.
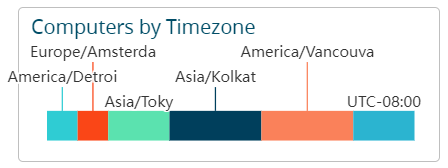
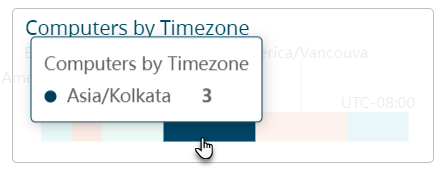
Computers Timezone
Provides the details of the computers that are connected to DSUA by geographical locations.
Package Status
Provides the package status installed on the computers.
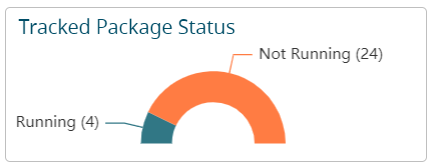
Mouse-hover the pie chart to view its details.
Package Running Instance
Provides the status of the package running instance installed on the computers.
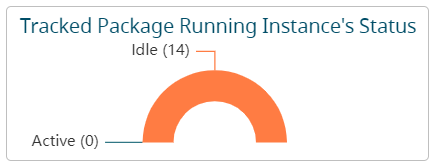
Mouse-hover the pie chart to view its details.

Package History
Provides a bar chart of the packages installed and its executions on the computers.
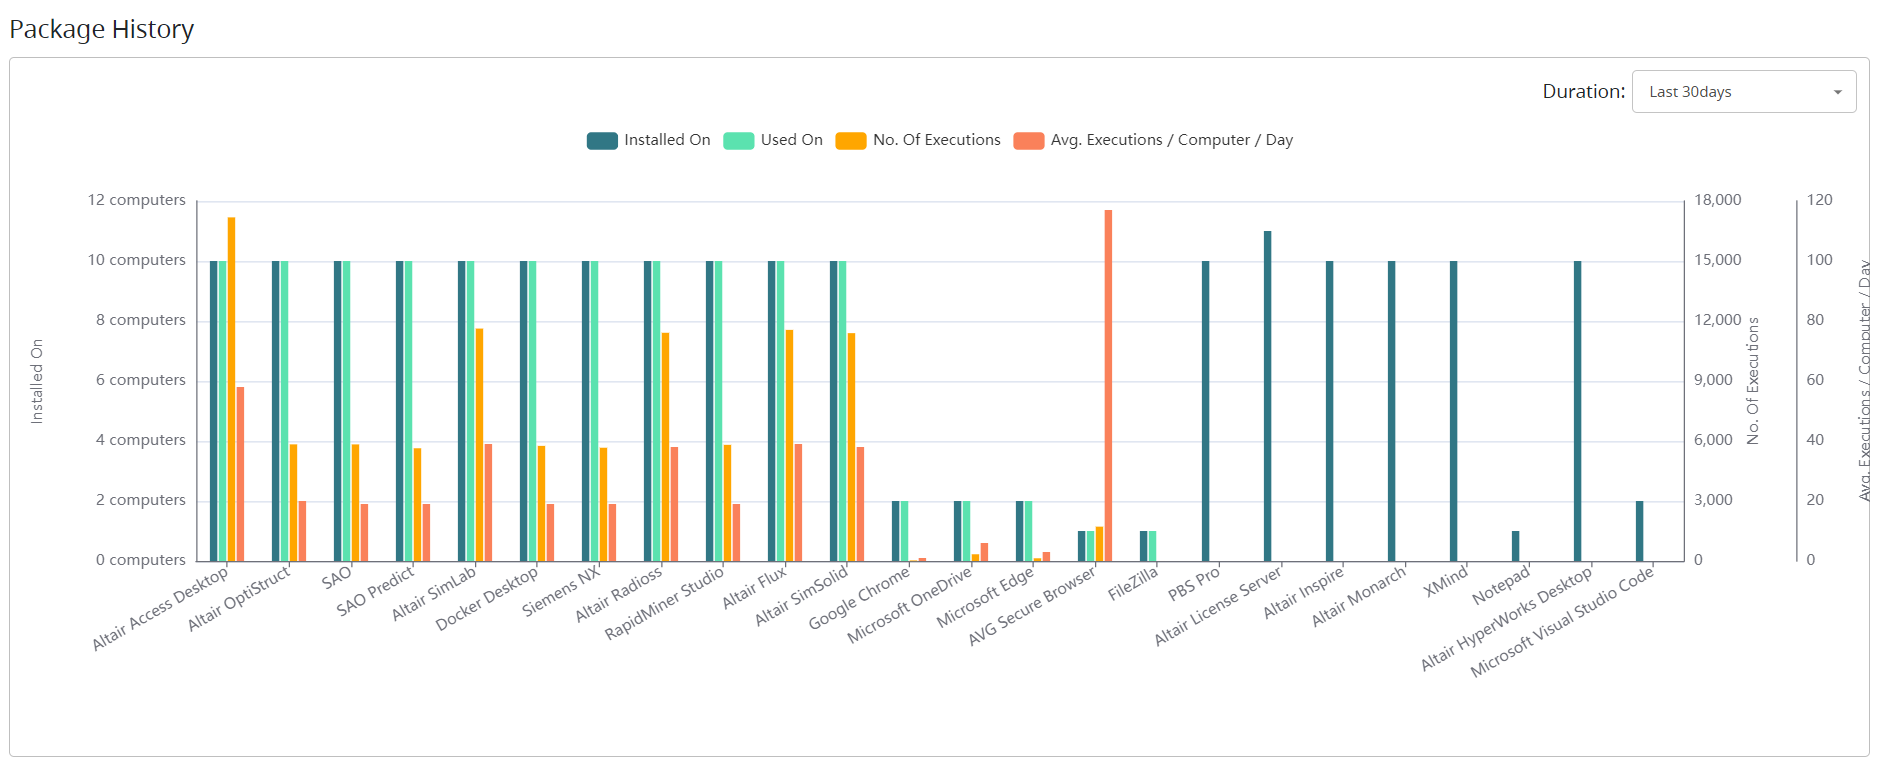
Package History Details
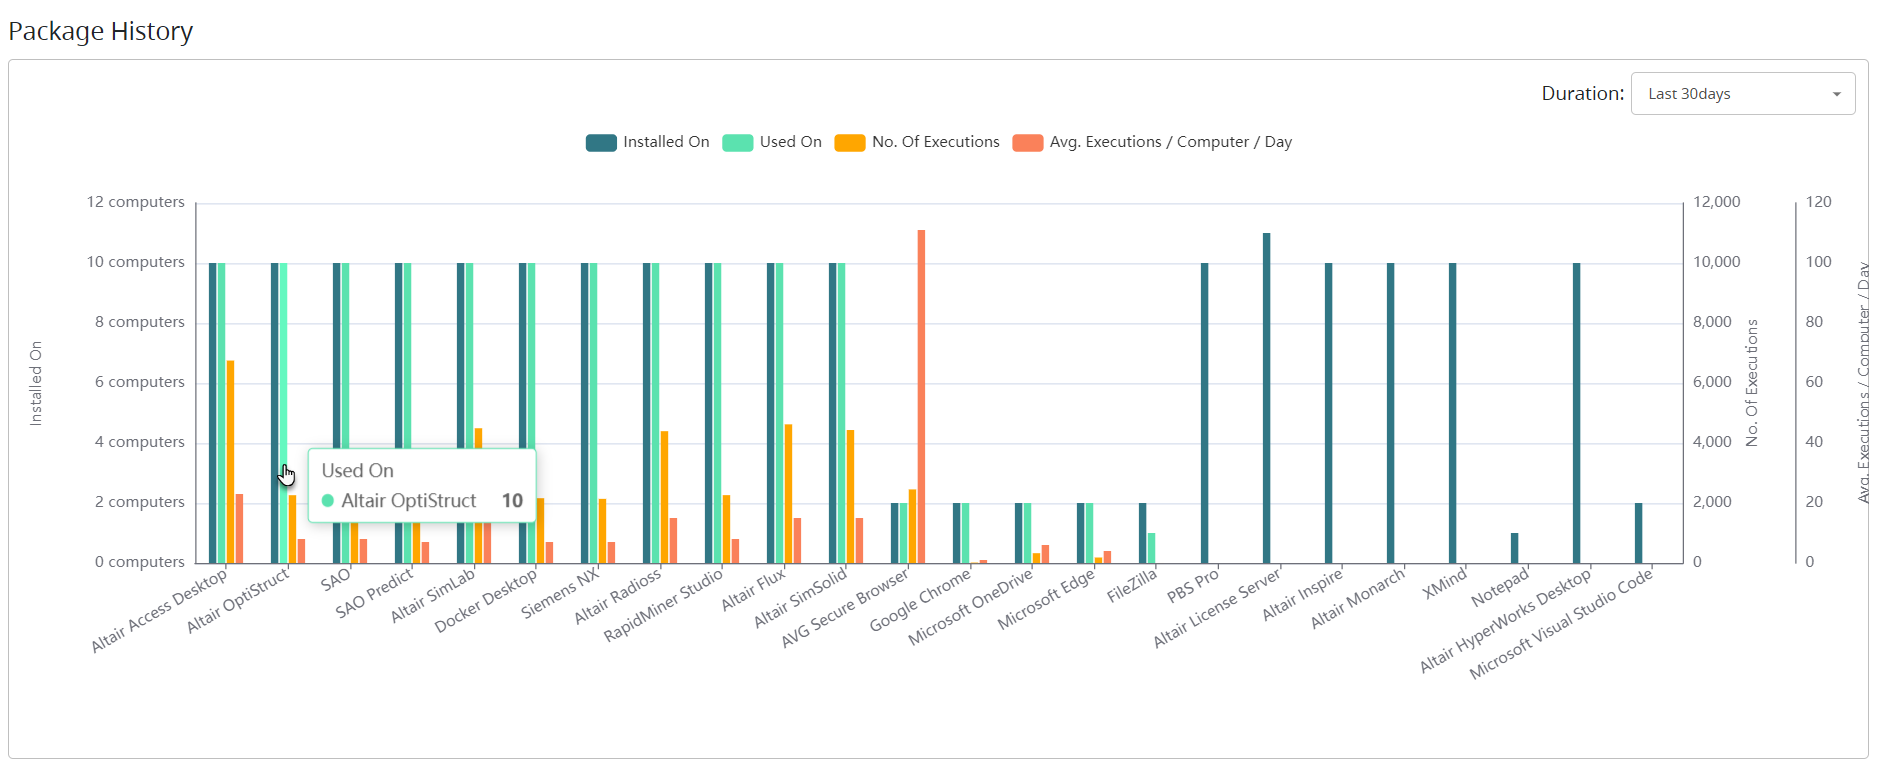
Chart Duration
By default, the bar chart displays the information for the past 30 days duration.
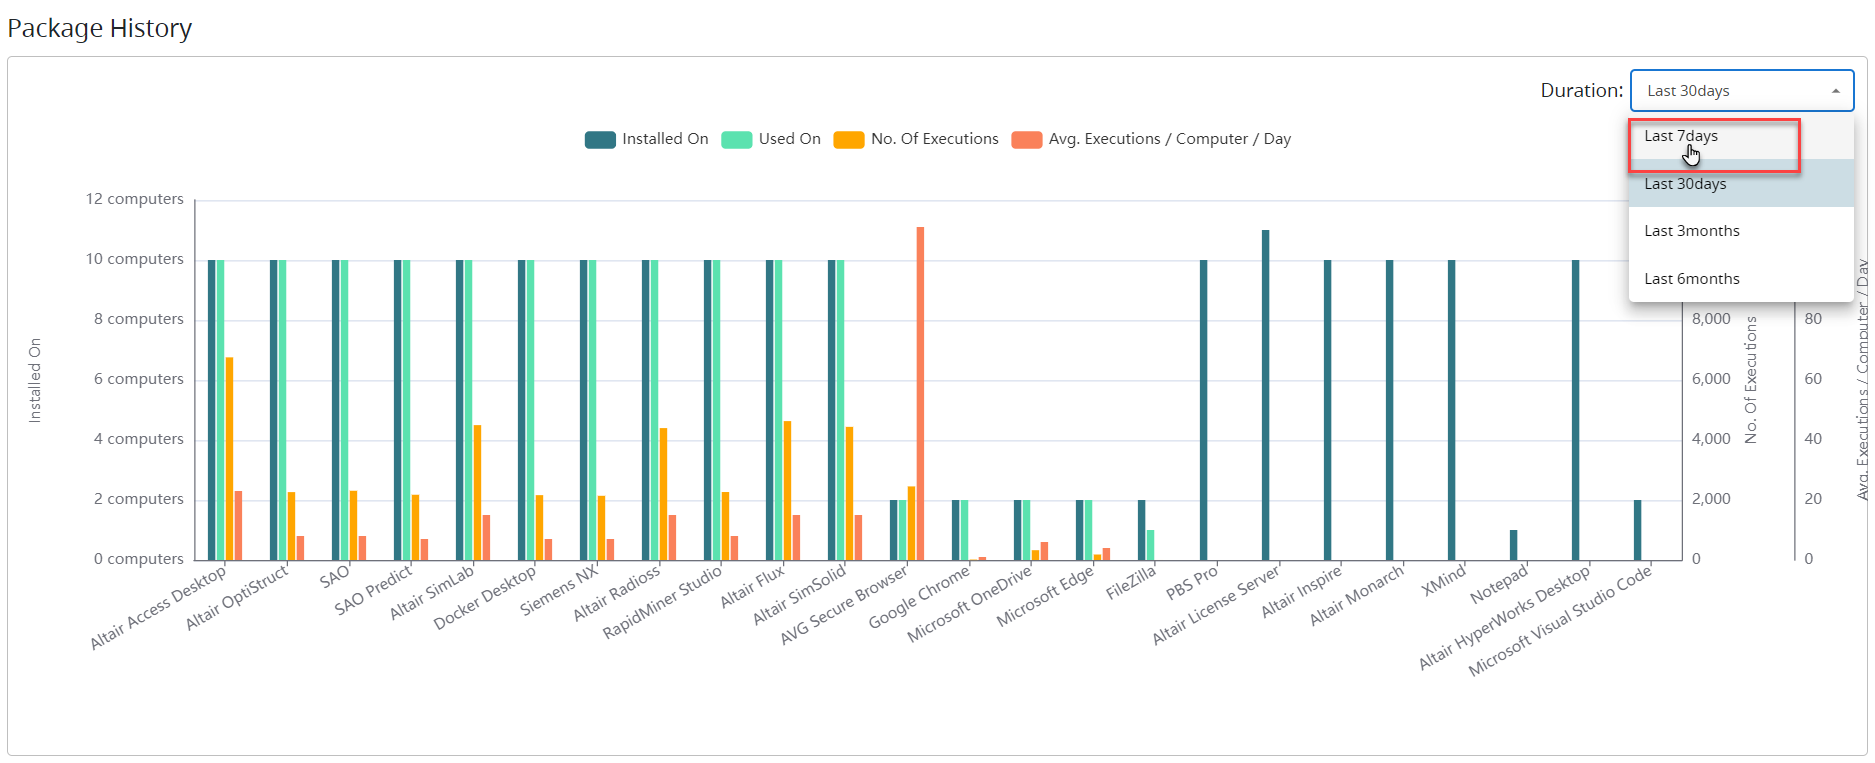
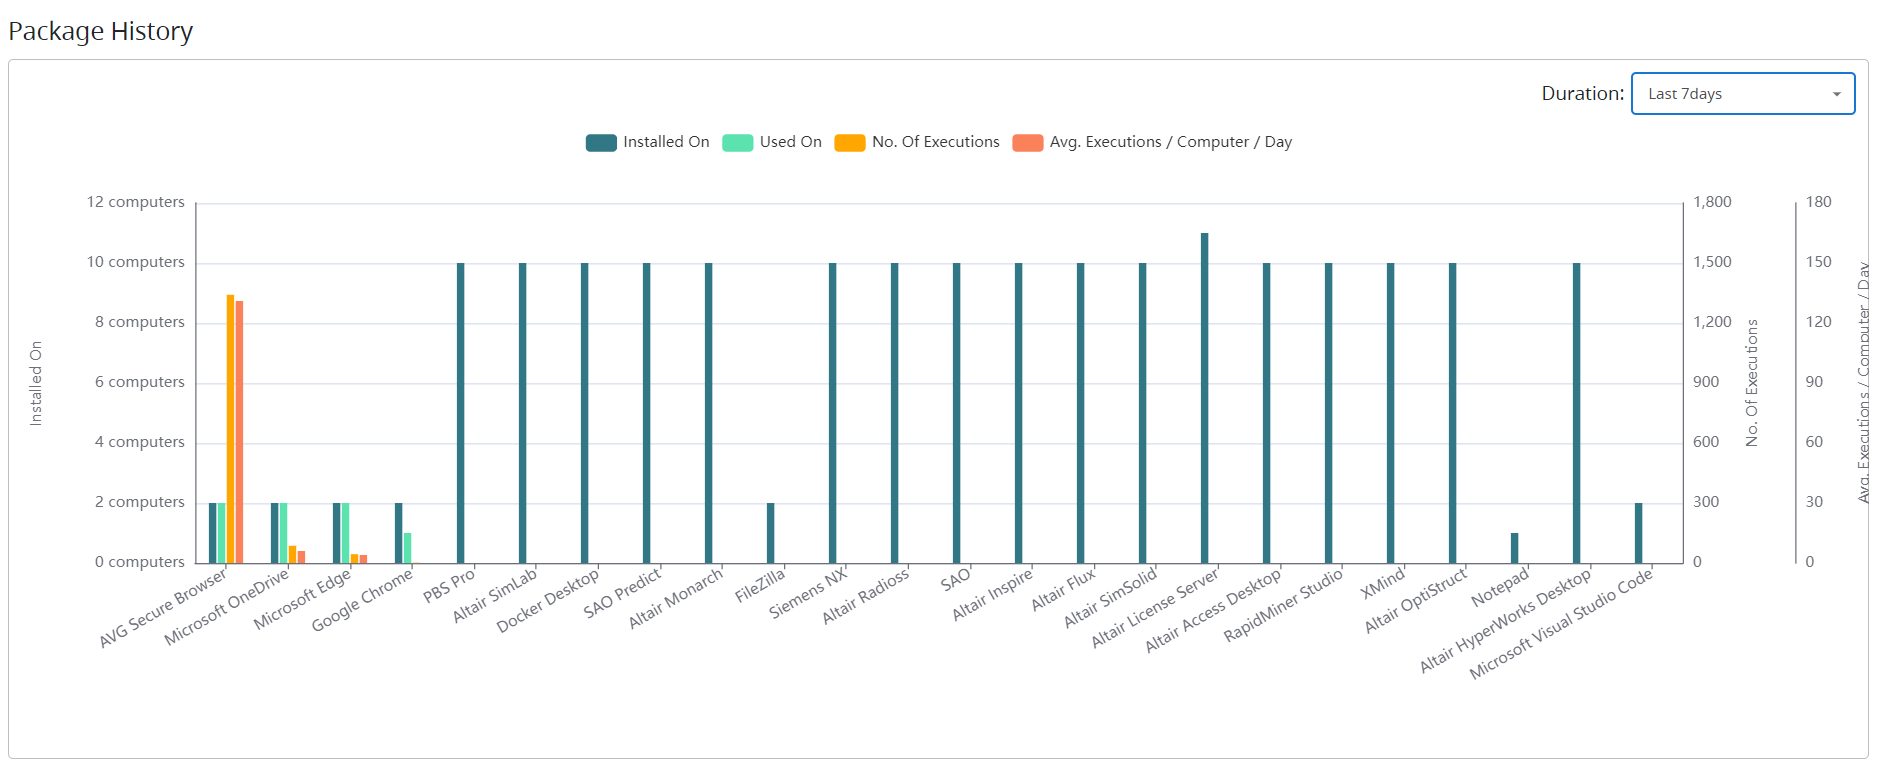
Chart Legends

The legend of the chart allows you to hide and show the bar from the chart view. Hide all the bar chart related to the legend using the chart legend at the top.
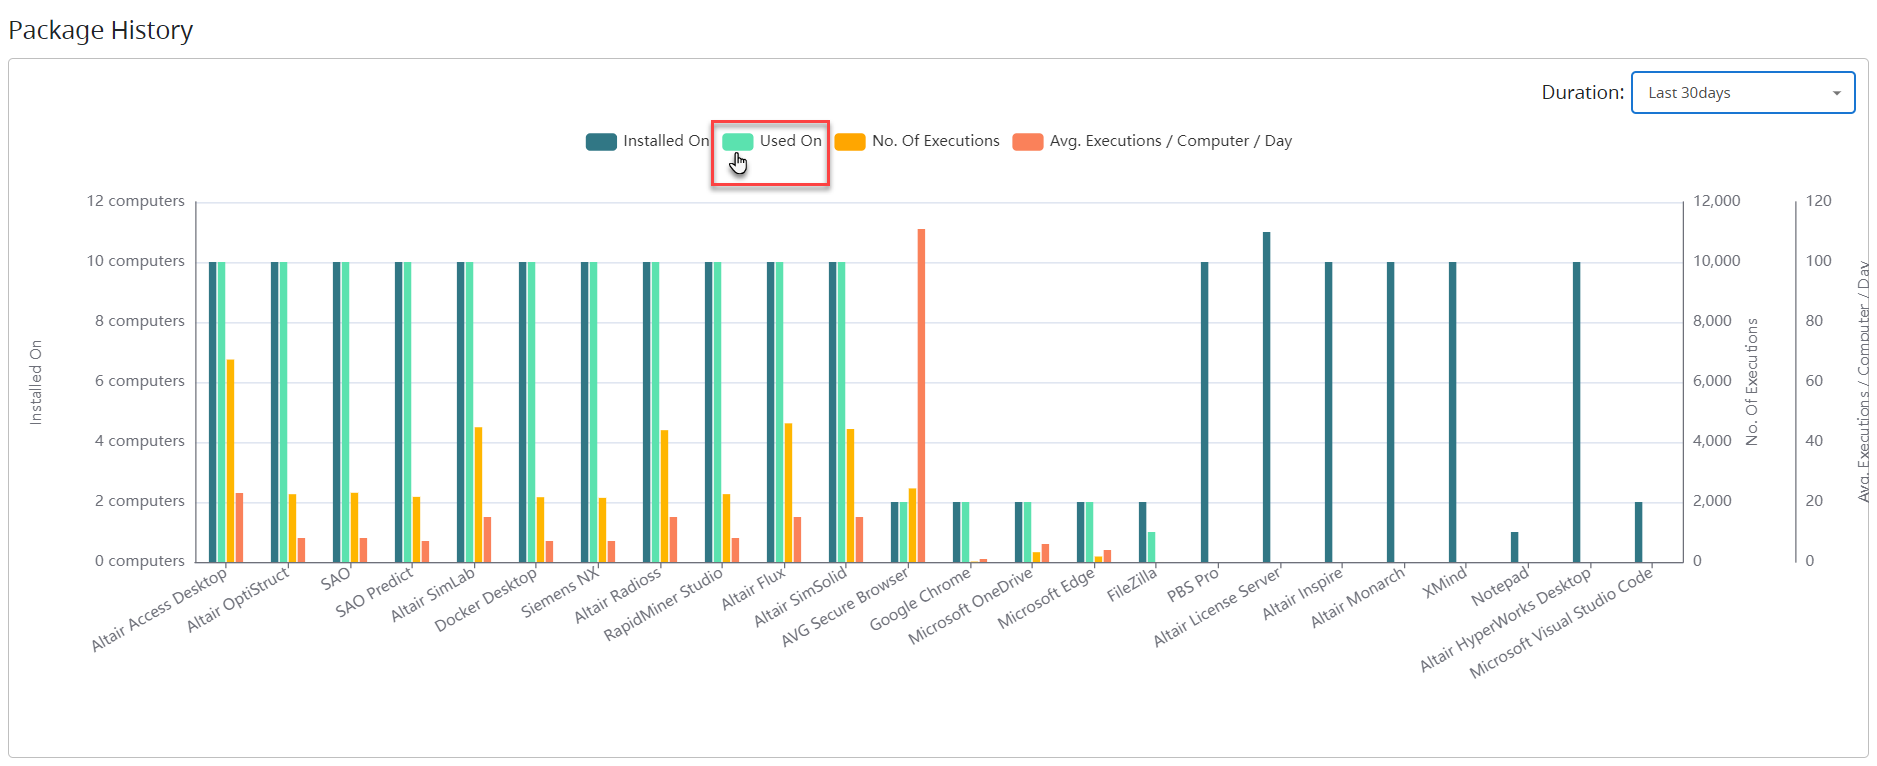
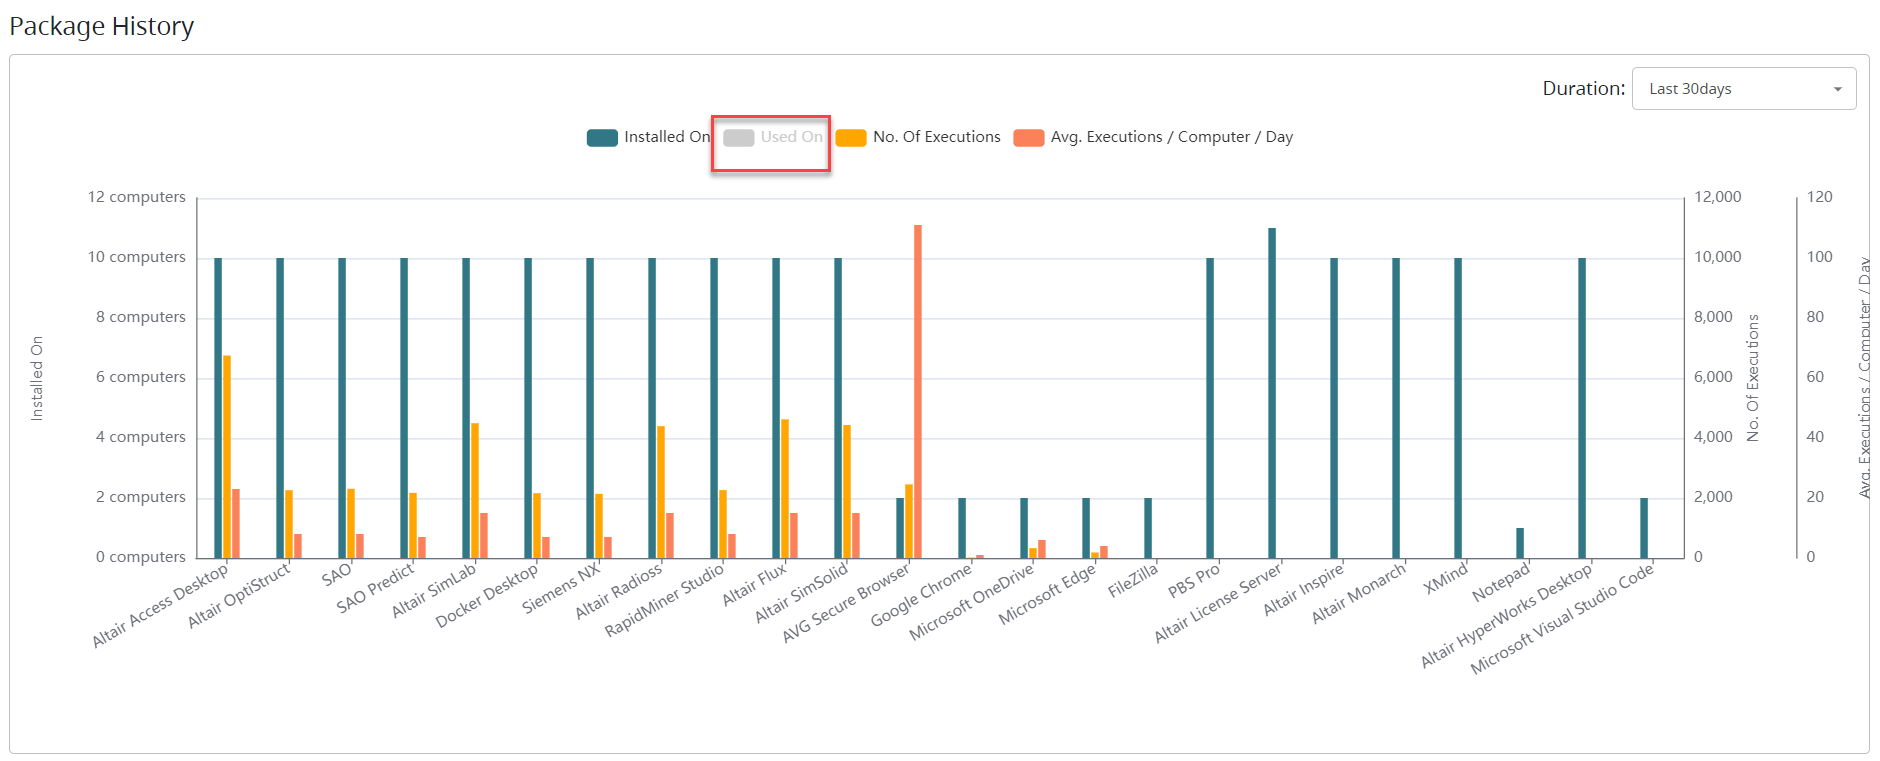
Click the legend again to view the bar in the chart.
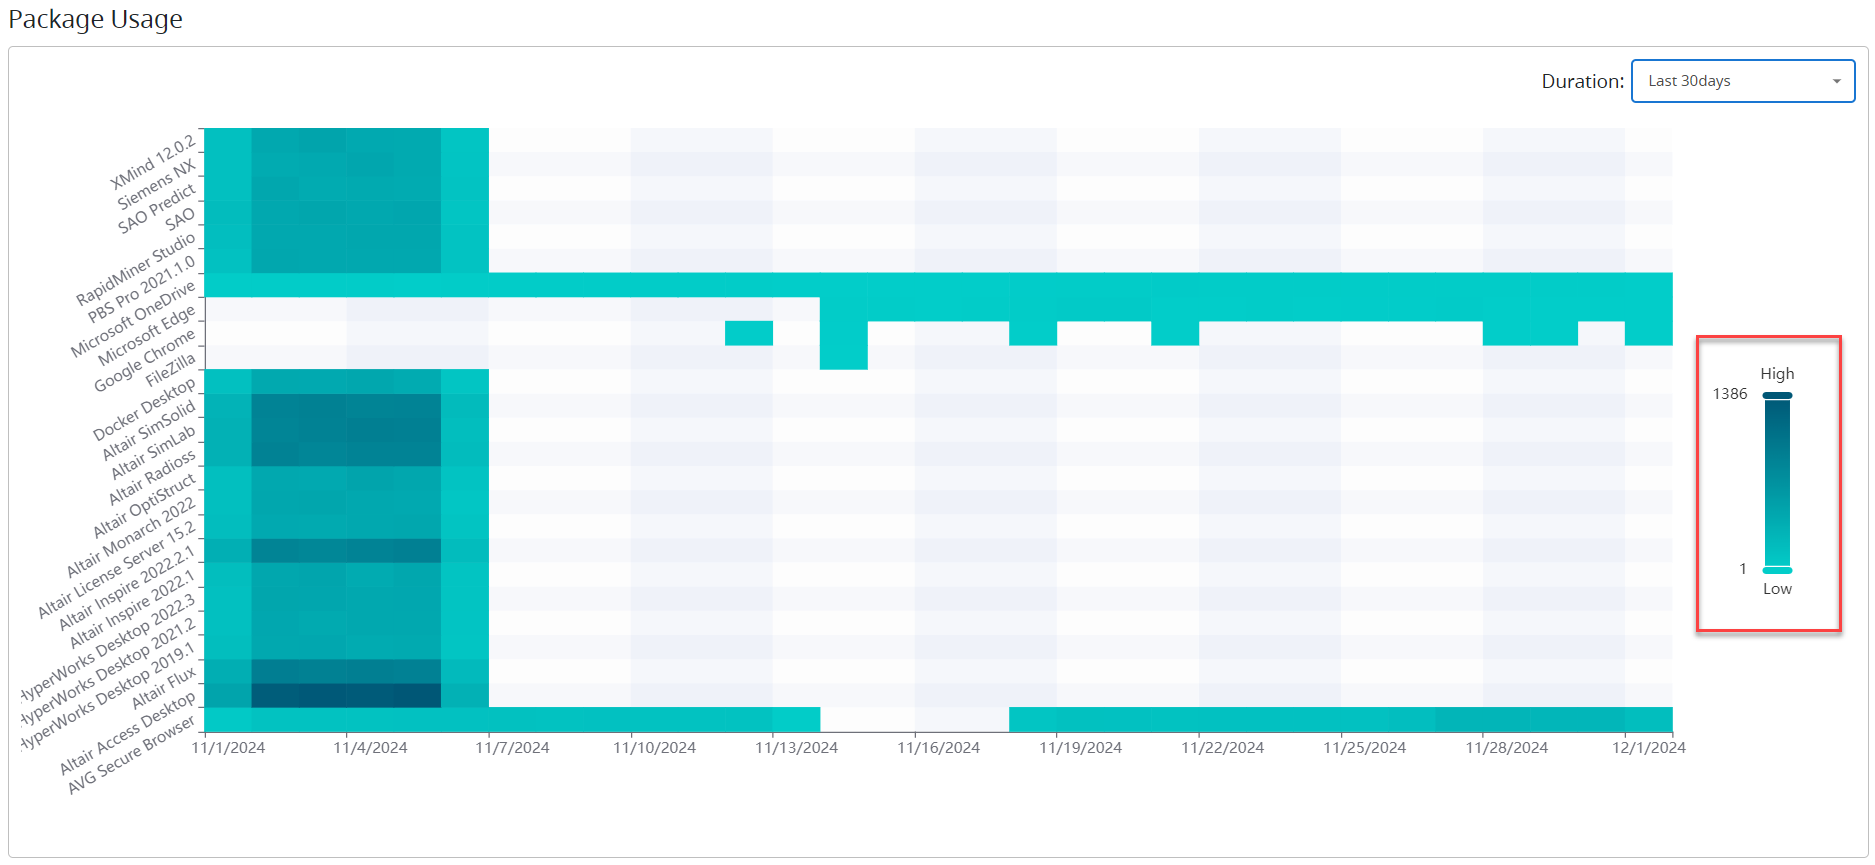
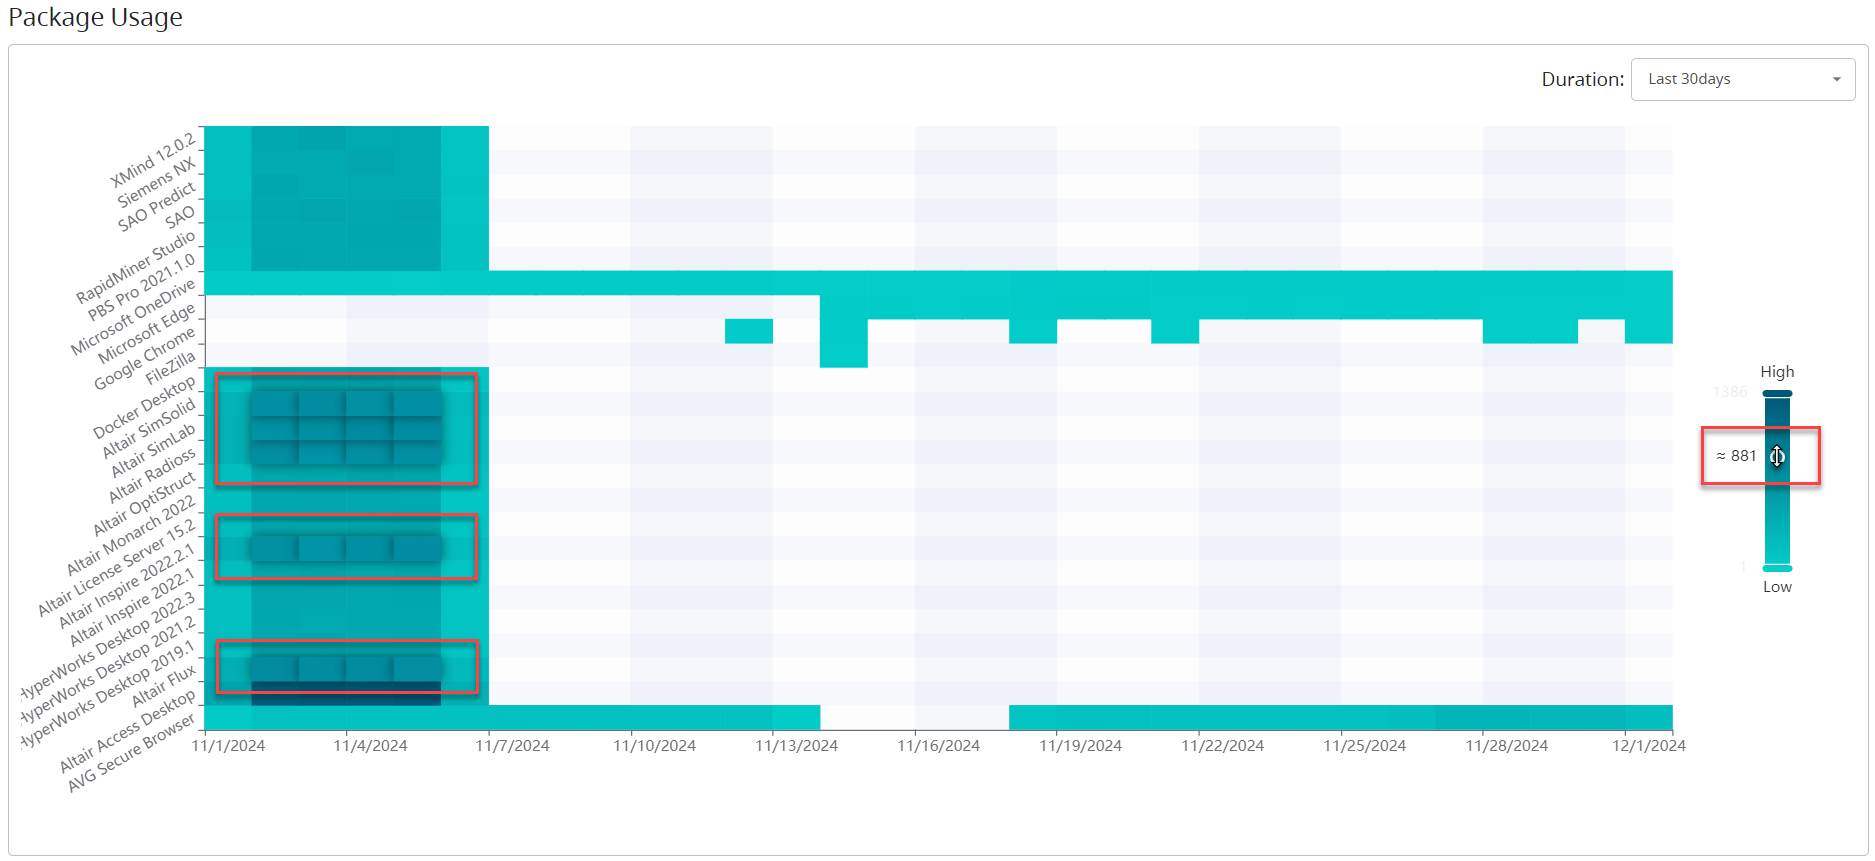
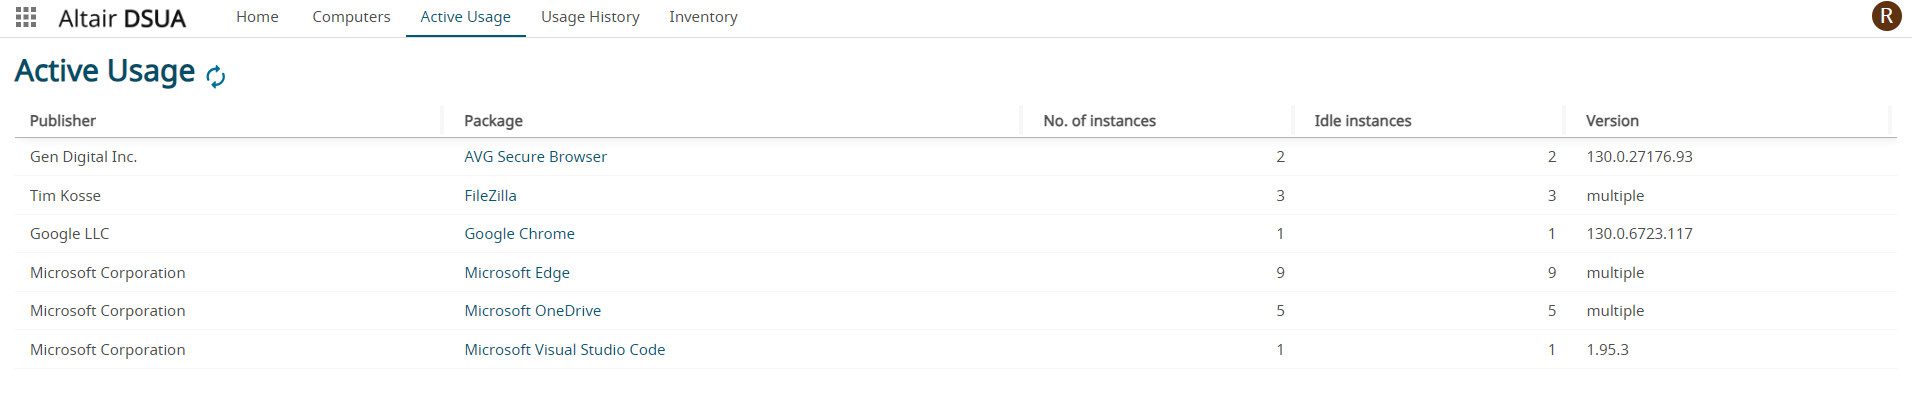
Package Usage
Provides a block chart of the package executions on the computers on a particular day.
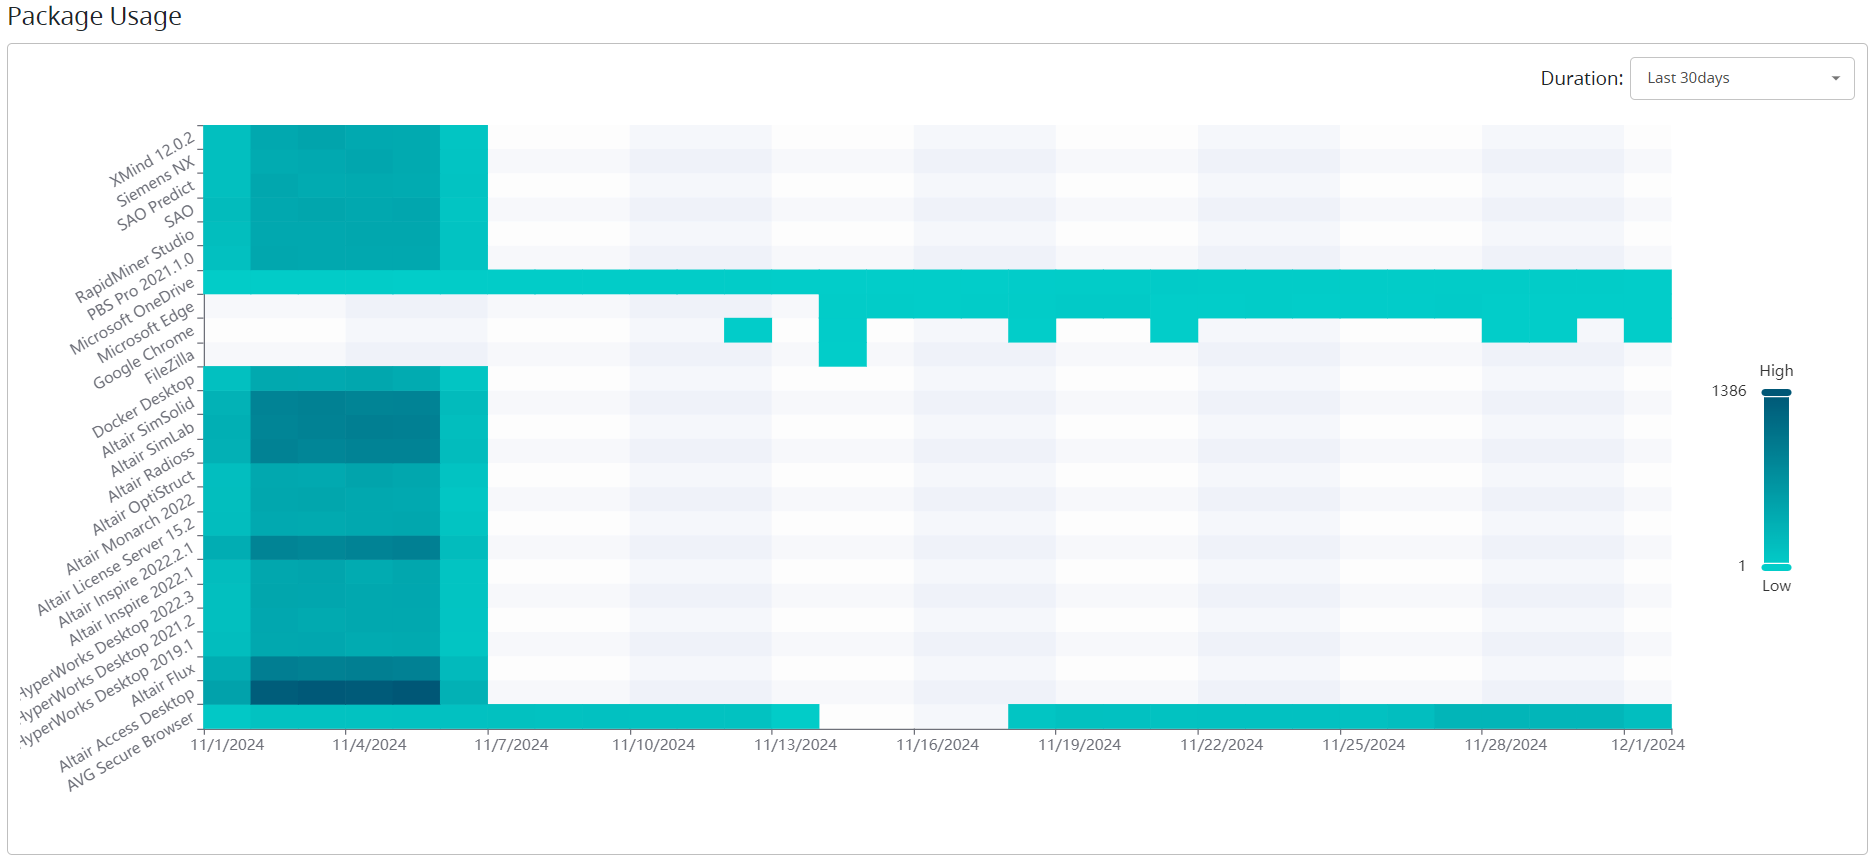
Package Usage Details
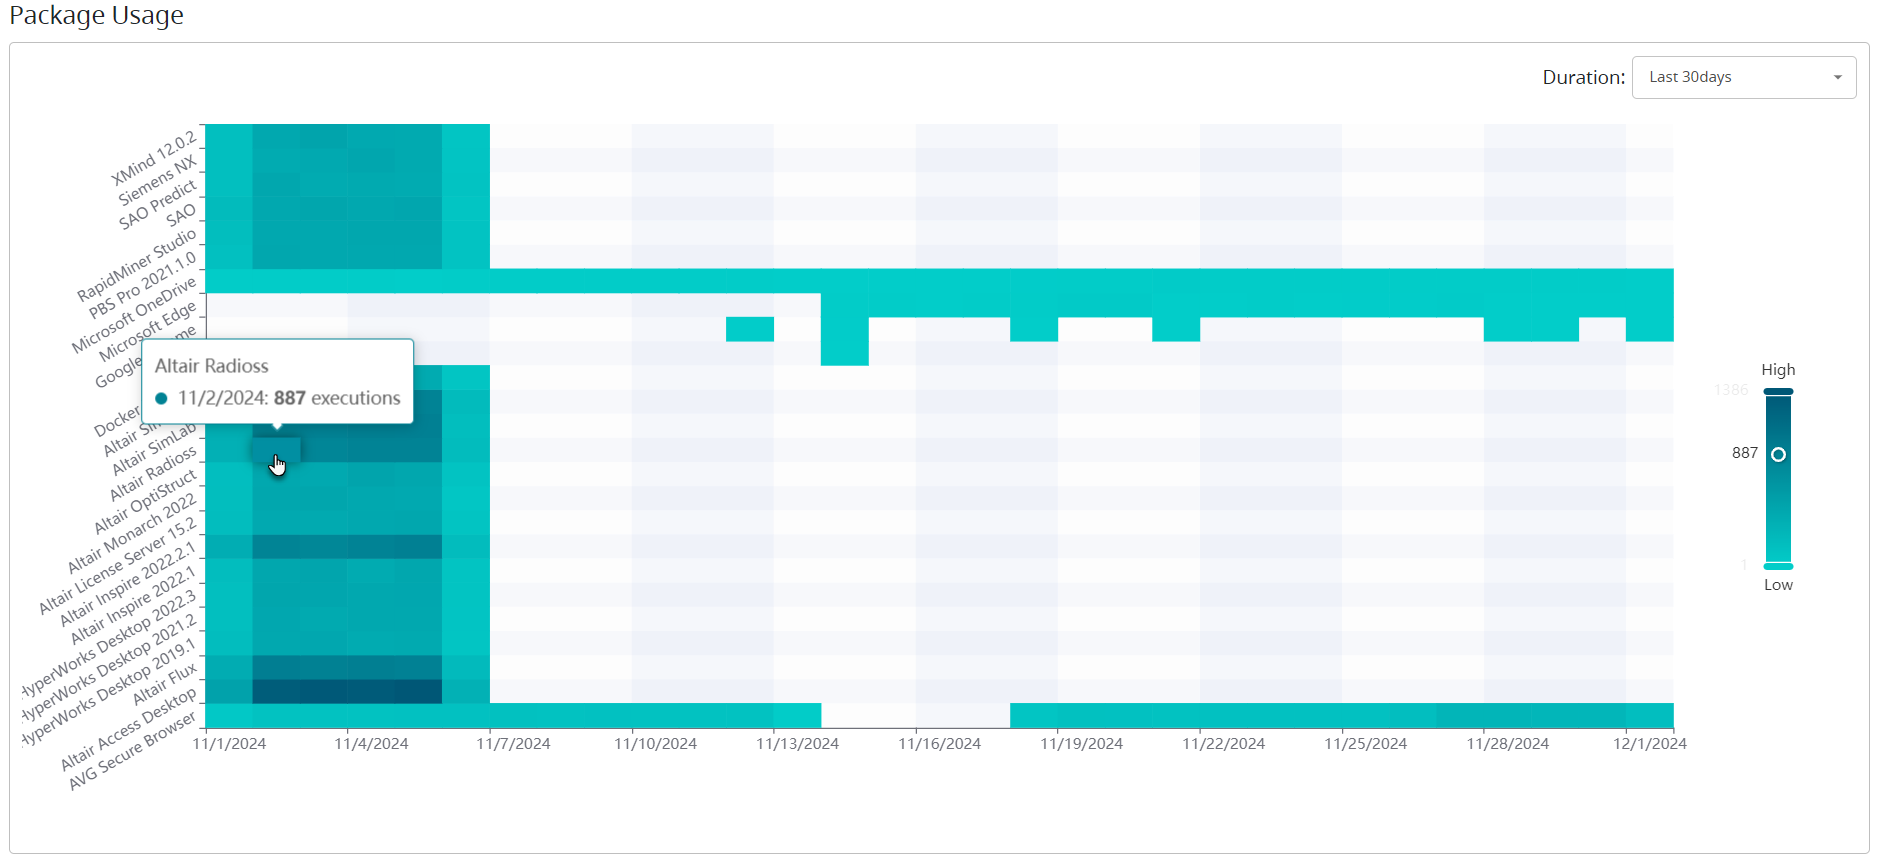
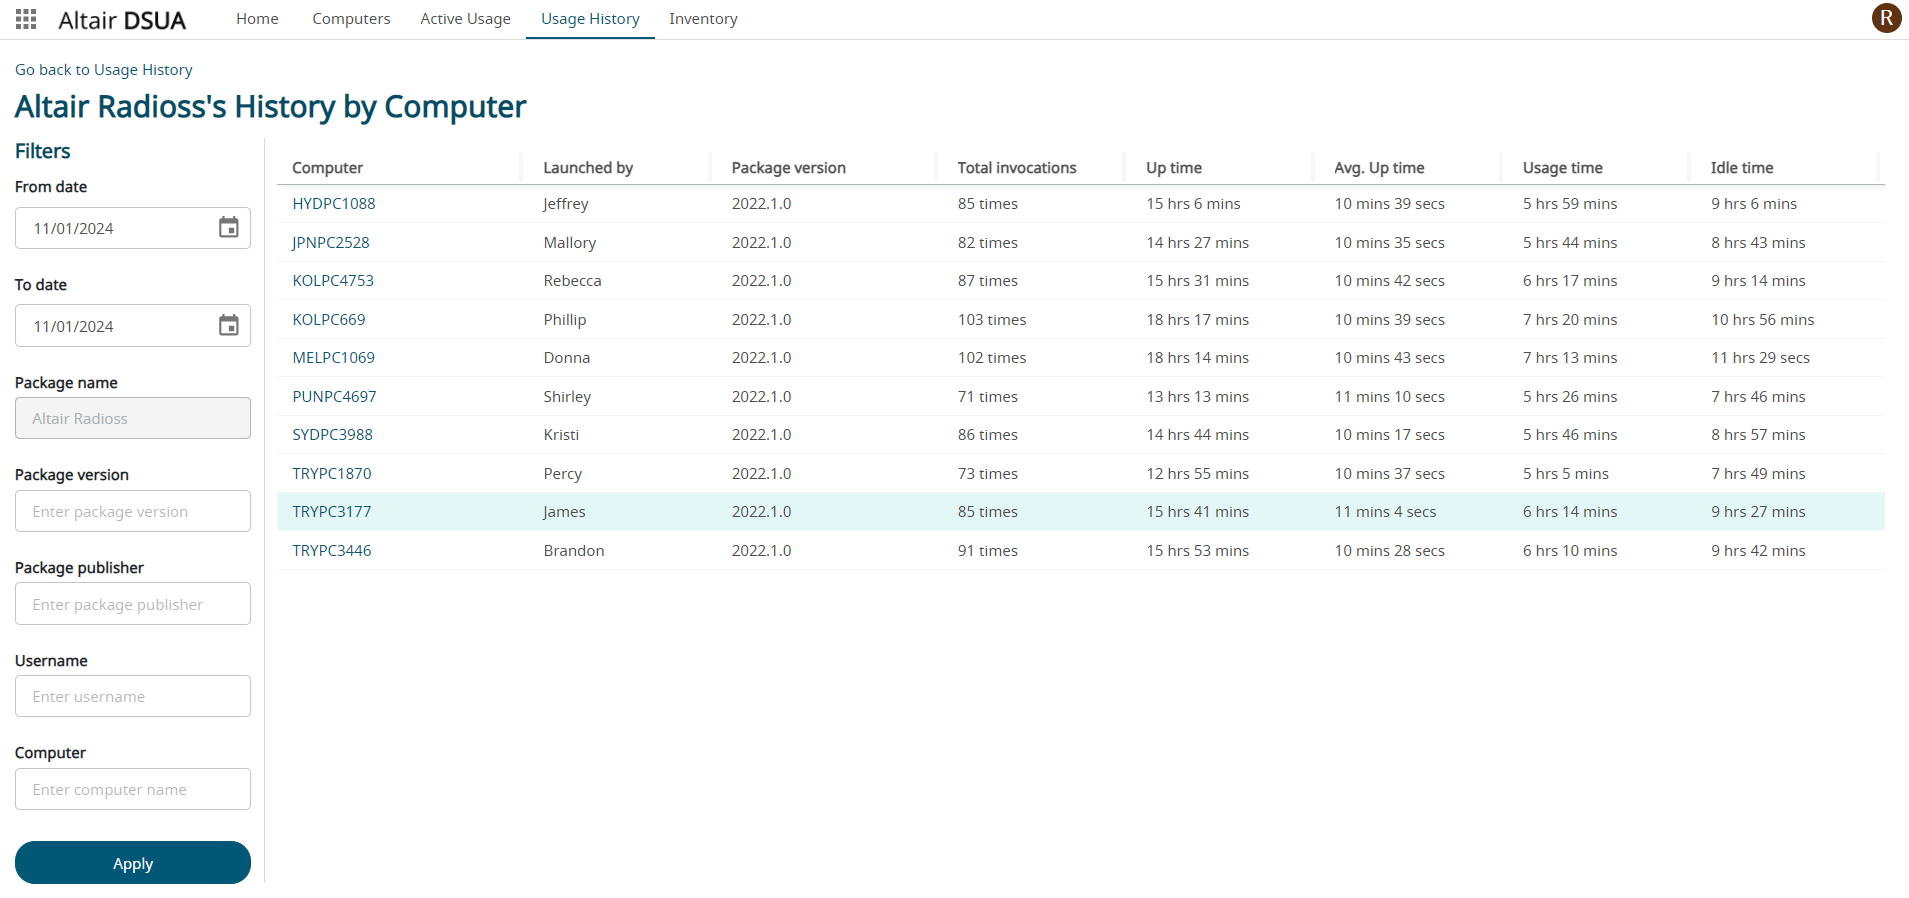
Chart Duration
By default, the block chart displays the information for the past 30 days duration.
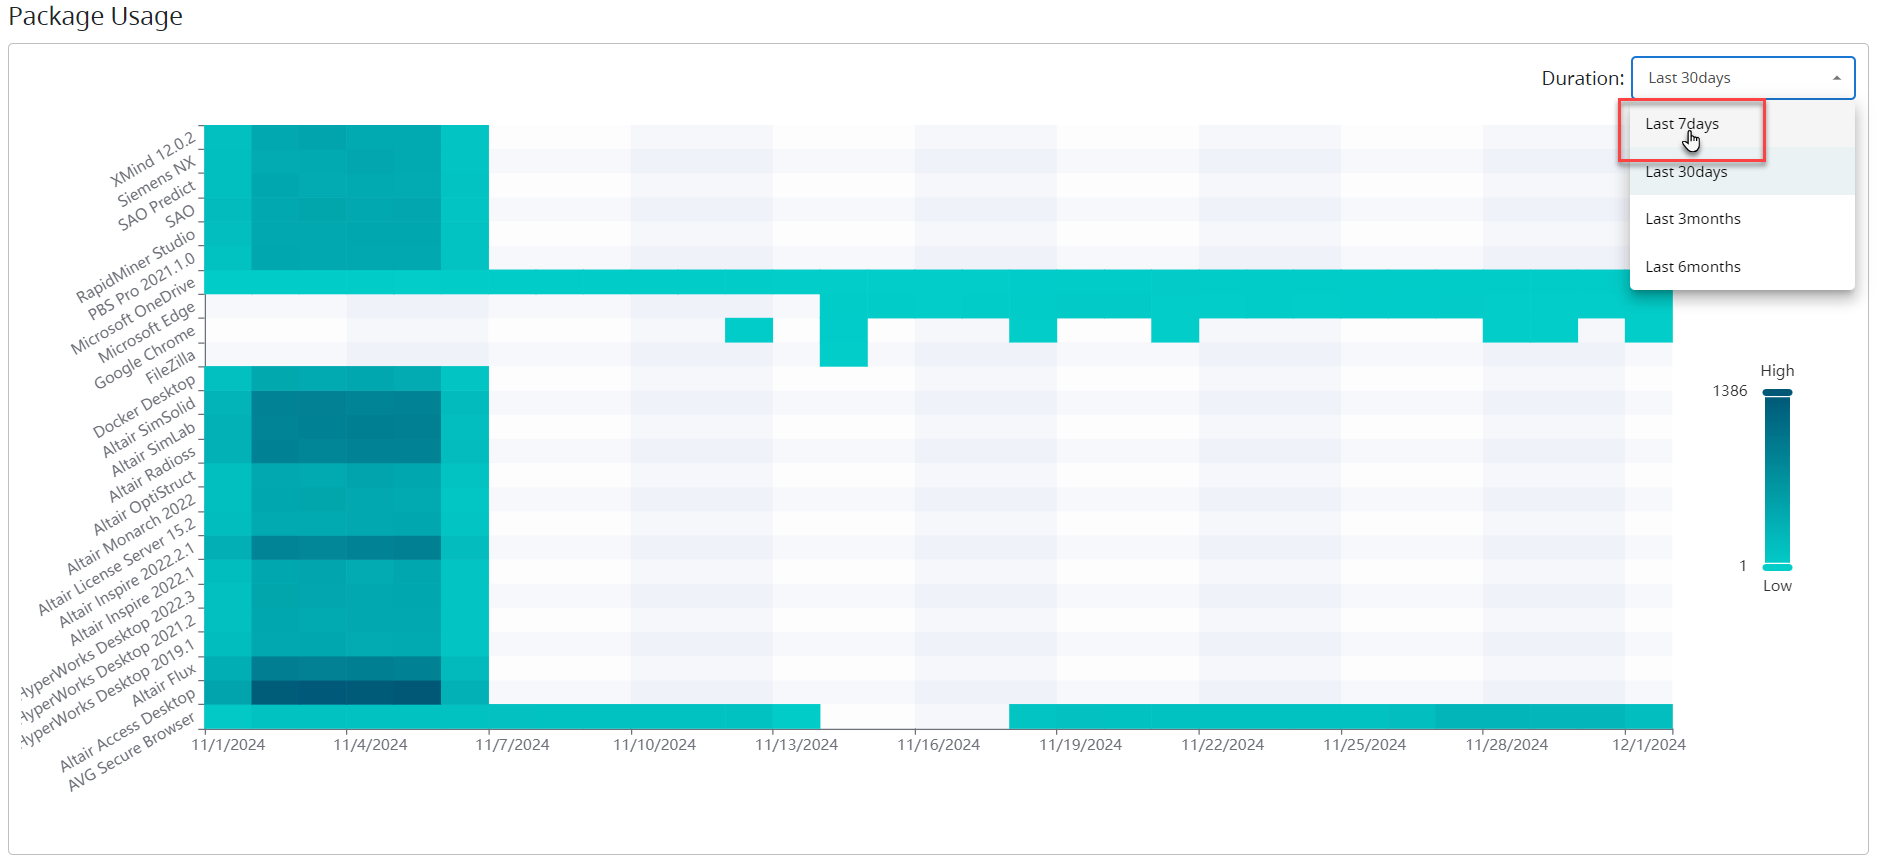
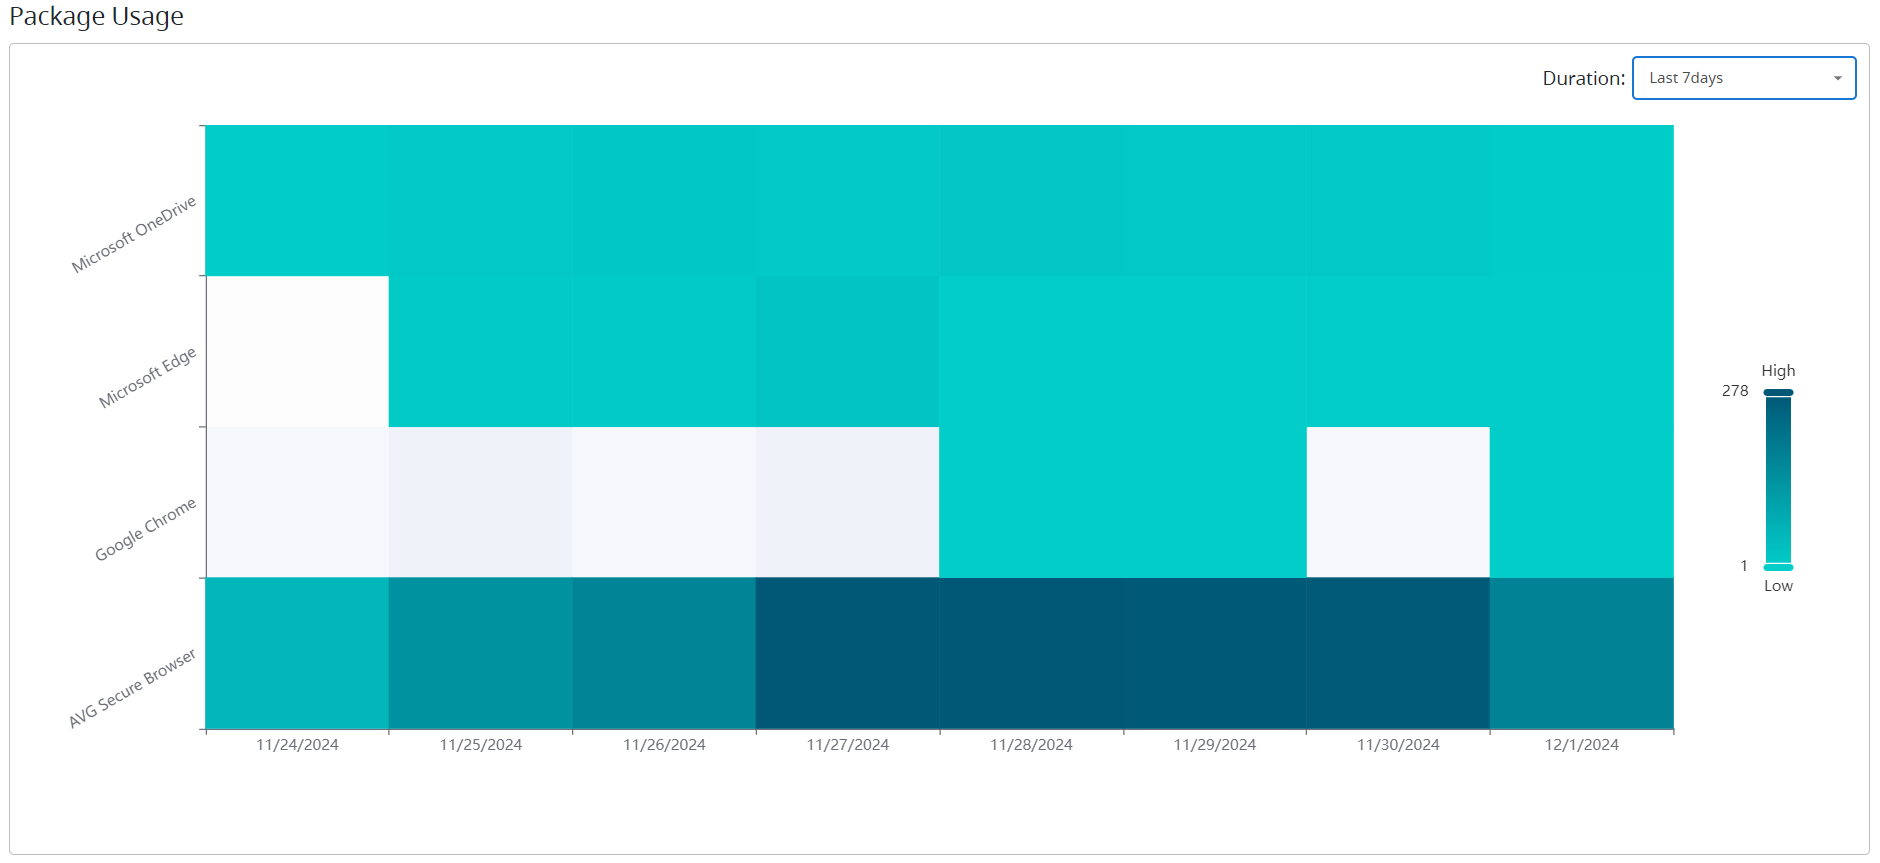
Chart Color