Injection Mold Mapping
Use the Injection Molding ribbon to facilitate the development of accurate structural simulation models for reinforced injection molded parts and assemblies.
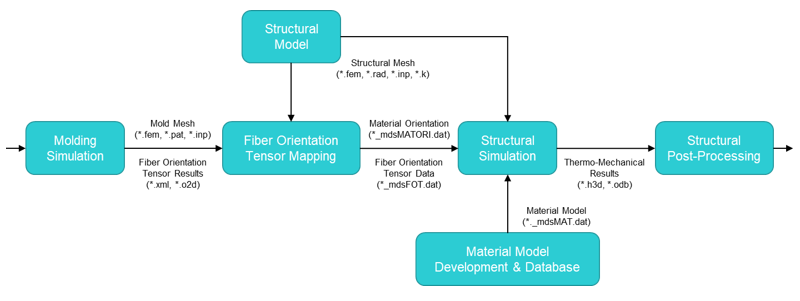
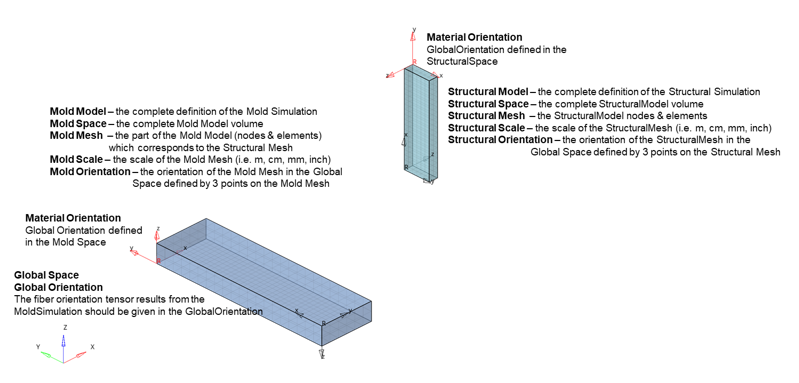
The injection molding – structural simulation workflow is described graphically in Figure 1. Definitions for the mold simulation space and structural simulation space are defined in Figure 2 and used consistently throughout describing the process. The starting point for this workflow is an injection molding simulation of a reinforced part or assembly.
The output from the injection molding simulation is the mold mesh in OptiStruct (*.fem), Patran (*.pat), Abaqus (*.inp), or the CADMOULD (*.cfex) format and the fiber orientation tensor results file in Altair Inspire Mold (*.xml), Moldflow (*.xml), Moldex3D (*.o2d), or the CADMOULD (*.cofx) formats.
The fiber orientation tensor results from the molding simulation must be mapped from the mold mesh to the structural mesh, which can be in any of OptiStruct (*.fem), Radioss (*.rad), Abaqus (*.inp), or LS-DYNA (*.k) formats. The mapping process is performed in HyperMesh using the injection molding ribbon. The output of the fiber orientation tensor mapping process is heterogeneous fiber orientation tensor data (*_mdsFOT.dat) and a material orientation system (*_mdsMATORI.dat) on the Structural Mesh in the Altair Multiscale Designer format.
When coupled with an Altair Multiscale Designer discontinuous fiber material model (*_mdsMAT.dat), a full heterogeneous anisotropic thermos-mechanical structural simulation can be performed. Each step of the injection molding – structural simulation workflow is described further below.
The intention of the Injection Molding ribbon is to work from left to right through the workflow for each injection molded part or a possible assembly individually. It is not suggested to go backwards in steps, and some steps exclude going back. However, some steps can be run multiple times if incorrect data is entered in the execution of the current or prior step. The intended workflow (order) of the steps as given on the ribbon from left to right is:
- 1. Import Mold Mesh
- Can rerun but should “Create New Model” before rerun.
- 2. Create Orientation Field
- Can run multiple times; each time creates a new field; only one of fields can be used. The last field generated is automatically selected.
- 3. Process Mold Mesh
- Can only run once and after execution cannot perform any prior step; must move to Import Structural Mesh step, or, “Create New Model” and start over from beginning.
- 4. Import Structural Mesh
- Can rerun but should “Delete Components” first.
- 5. Process Structural Mesh
- Can execute multiple times until Structural Mesh is positioned in Mold Space correctly but cannot redefine Mold Mesh points only Structural Mesh points.
- 6. Map and Export
- Can be executed multiple times; will overwrite files from previous execution.
Import Mold Mesh
Import the mold simulation mold mesh in either OptiStruct (*.fem), Patran (*.pat), or Abaqus (*.inp) formats.
-
From the Injection Molding ribbon, select the Import Mold
Mesh tool.
Figure 3. 
-
Select the mold mesh file then click Import.
Figure 4. 
Create Orientation Fields
Create a field of fiber orientation tensor results on the mold mesh given a fiber orientation tensor results file (Altair Inspire Mold *.xml, Moldflow *.xml, or Moldex3D *.o2d) consistent with the current loaded model (imported mold mesh).
-
From the Injection Molding ribbon, select the Create Orientation
Field tool.
Figure 5. 
- Click Choose File on the guide bar and select a fiber orientation tensor results file.
- Optional:
Select elements for which fiber orientation tensor results exist in the
selected results file.
All elements of the mold mesh are selected by default and no further selection is typically needed. However, if a subset of elements is needed, check Select elements.
-
Click
 .
The output are fields called “FiberOrienation#” which reference the fiber orientation tensor results file (*.xml or *.o2d) and a table called “FiberOrienationMoldSpace#”. The table contains the definitions for mold mesh (nodes and elements) so that source mesh information is retained when the mold mesh is removed from the HyperMesh modeling environment to bring in the structural mesh target mesh.
.
The output are fields called “FiberOrienation#” which reference the fiber orientation tensor results file (*.xml or *.o2d) and a table called “FiberOrienationMoldSpace#”. The table contains the definitions for mold mesh (nodes and elements) so that source mesh information is retained when the mold mesh is removed from the HyperMesh modeling environment to bring in the structural mesh target mesh.Figure 6. 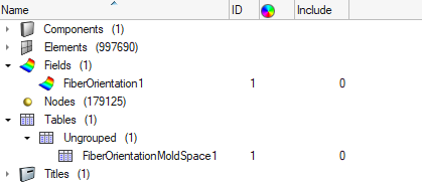
Process the Mold Mesh
Obtain mold mesh information required to map fiber orientation tensors to the structural mesh.
-
From the Injection Molding ribbon, select the Process Mold
Mesh tool.
Figure 7. 
- Optional:
Select a field that contains the fiber orientation tensor results from the
molding simulation.
The field selector should automatically be populated from the prior step. However, you can choose a different field if needed.
-
Select elements of the mold mesh representing the volume of the mold space into
which the structural mesh will be mapped.
If the Select elements option is unchecked, all elements of the mold mesh are automatically selected. Typically, you should select elements of the mold mesh removing any sprue, runners, and gates and/or select a single part of a multiple part mold.
-
Select 3 non-colinear reference nodes on the mold mesh which will correspond to
the same 3 non-colinear reference nodes on the structural mesh to be selected
later.
The first node selected defines a unique origin node which can also be exactly identified on the structural mesh. The second node selected defines the vector (N1-N2) and calculates a distance on the mold mesh which can also be identified on the structural mesh and is used to scale the structural mesh into the mold space. The third node selected defines the plane normal to the vectors (N1-N2 and N1-N3) which can also be identified on the structural mesh and is used to orient the structural mesh into the mold space and calculate the material orientation.
-
Click
 on the guide bar to define
options for processing mold mesh.
Mold mesh visualization data (fiber orientation tensor contours) are always generated. However, options can be used to define if mold mesh histogram data should be generated or not. Options for generating histogram data include:
on the guide bar to define
options for processing mold mesh.
Mold mesh visualization data (fiber orientation tensor contours) are always generated. However, options can be used to define if mold mesh histogram data should be generated or not. Options for generating histogram data include:- Number of increments (10, 20, 50, 100)
- Defines the number of buckets between 0.0 – 1.0 for normal tensor components (a11, a22, a33) and -0.5 - +0.5 for shear tensor components (a12, a23, a13).
- Fiber orientation tensor components (all, normal, shear)
- All includes all tensor components. Normal includes just (a11, a22, a33), and shear includes just (a12, a23, a13).
- Normalize on element volume
- This option uses the element volume to normalize the histogram data instead of a simple count. This option is important to activate if your mesh is not of reasonable uniform element size; otherwise, leave it off.
Figure 8. 
-
Click .
The output of this step is a component called “MoldSpace” which contains a bounding box visualization (transparent geometry) of the mold mesh. This visualization will be used to ensure proper scale and position of the structural mesh in the following steps. In addition, calculated and stored in memory, is transformation information associated with the mold mesh. This information will be used along with transformation information on the structural mesh, obtained in the following steps, to calculate the total transformation information and final material orientations needed on the structural mesh.
Figure 9. 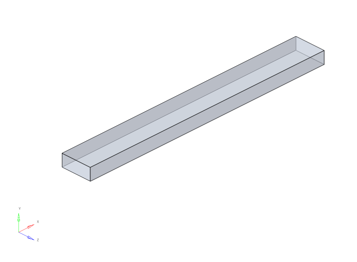
Import Structural Mesh
Import the structural simulation structural mesh in either OptiStruct (*.fem), Radioss (*.rad), Abaqus (*.inp), or LS-DYNA (*.k) formats
-
From the Injection Molding ribbon, select the Import Structural
Mesh tool.
Figure 10.
-
Select the structural mesh file then click Import.
Figure 11. 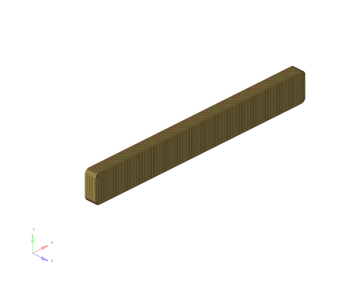
Process Structural Mesh
Scale and position the structural mesh into the mold space.
-
From the Injection Molding ribbon, select the Process Structural
Mesh tool.
Figure 12. 
-
Select 3 non-colinear reference nodes on the structural mesh that correspond to
the same 3 non-colinear reference nodes defined on the mold mesh.
The first node selected defines the origin node which corresponds exactly to the same origin node defined on the mold mesh. The second node selected defines the vector (N1-N2) and calculates the distance on the structural mesh which corresponds to the same distance defined on the mold mesh and is used to scale the structural mesh to the mold space. The third node selected defines the plane normal to the vectors (N1-N2 and N1-N3) which corresponds to the same plane defined on the mold mesh and is used to position the structural mesh to the mold space.
-
Click .
The output of this step is a scaled and positioned structural mesh in the mold space. In addition, calculated and stored in memory, is transformation information associated with the structural mesh. This information combined with transformation information on the mold mesh, obtained in the prior steps, allows final calculation of the total transformation information and final material orientations needed on the structural mesh.
Figure 13. 
Map and Export Data
Map fiber orientation tensor results from the mold mesh to the structural mesh and export mapped fiber orientation tensor data on the structural mesh for Multiscale Designer material models.
-
From the Injection Molding ribbon, select the Map and
Export tool.
Figure 14. 
- Optional:
Select a field that contains the appropriate fiber orientation tensor result
file reference and mold mesh table data.
The field selector should automatically be populated from the prior step. However, you can choose a different field if needed.
-
Click on the guide bar to define
options.
Structural mesh visualization data (fiber orientation tensor contours) are always generated. However, options can be used to define Field Realization/Mapping options, Multiscale Designer data output options, and structural mesh histogram data generation options. Each set of options is described below:
- Field Realization Options
-
- Field realization method (shapefunctionandproximity, shapefunction, proximity, and inversedistanceweighting)
- The default and recommended field realization method is shapefunctionandproximity.
- Search radius
- Used to define how far from a target mesh data location a source mesh data point is to be searched for. If no source data points are found within the search radius, the nearest source mesh data points are automatically used. Default value of 0.0 uses the default values of search radius in the field realization algorithm.
- Tolerance
- The maximum distance to project a target mesh data point onto the source mesh if a target mesh data point falls outside the source mesh. Default value of 0.0 uses the default values of tolerance in the field realization algorithm which is the current model setting for global node tolerance.
- Multiscale Designer Material Model Export Options
-
- Number of slices (7, 15, 37, 73)
- Used to control the number of slice orientations generated for each fiber orientation tensor within an element or element layer. In general, 7 or 15 (default) will provide efficient and accurate results. Higher slices are allowable, but typically not necessary.
- Slices method (Average, Individual)
- This setting determines if material behavior (full damage and plasticity) happens on each individual slice independently, or if material behavior is homogenized to the average of all slices for each element or element layer. The default is Average.
- Structural Mesh Fiber Orientation Tensor Histogram Export Options
-
- Number of increments (10, 20, 50, 100)
- Defines the number of buckets between 0.0 – 1.0 for normal tensor components (a11, a22, a33) and -0.5 - +0.5 for shear tensor components (a12, a23, a13).
- Fiber orientation tensor components (all, normal, shear)
- All includes all tensor components. Normal includes just (a11, a22, a33), and shear includes just (a12, a23, a13).
- Normalize on element volume
- This option is important to activate if your mesh is not of reasonable uniform element size; otherwise, leave it off
-
Click .
The final output are several files, described below, which are used to visualize and verify the mapping process. Combined with a Multiscale Designer material model and applied to a structural model, they allow for structural simulation of the full heterogeneous anisotropic behavior of reinforced injection molded materials in reinforced injection molded parts. All output files are in the same directory as the Fiber Orientation Tensor Results File selected in the Create Orientation Fields step.
In the details below, [FOTName] stands for the Fiber Orientation Tensor Results File root name which is selected in the Create Orientation Fields. As an example, if C:\users\name\simulationdir\mypart.xml was the name of the fiber orientation tenor results file selected, then the root name [FOTName] would correspond to “mypart”. Further, all files would be output to the directory C:\users\name\simulationdir\.
- [FOTName].hwascii
Contains the fiber orientation tensor results on the mold mesh for use in creating visualizations (contours) of fiber orientation tensor components on the mold mesh in HyperMesh/HyperView.
- [FOTName].csv
Contains fiber orientation tensor histogram data on the mold mesh for use in creating histogram plots of fiber orientation tensor components on the mold mesh in HyperMesh/HyperGraph.
- [FOTNAME]_StructuralMesh_MoldSpace.fem
Contains an OptiStruct input file of the structural mesh in the mold space. Use this mesh to visualize the fiber orientation tensor components on the structural mesh in HyperMesh/HyperView so that easy comparison with the mold mesh results of the same can be compared in the same space.
- [FOTName]_mdsFOT.hwascii
Contains the fiber orientation tensor results on the structural mesh for use in creating visualizations (contours) of fiber orientation tensor components on the structural mesh in HyperMesh/HyperView.
- [FOTName]_mdsFOT.csv
Contains fiber orientation tensor histogram data on the structural mesh for use in creating histogram plots of fiber orientation tensor components on the structural mesh in HyperMesh/HyperGraph.
- [FOTName]_mdsMATORI.fem
Contains an OptiStruct (CORDR4) or Abaqus (*ORIENTATION) definition of the material coordinate system for the structural mesh in the structural space. This file should be imported into the structural simulation and assigned to the structural mesh appropriately to define the reference material orientation for each reinforced injection molded part.
- [FOTName]_mdsFOT.dat
Contains a Multiscale Designer definition of the fiber orientation tensors for each element of the structural mesh. This is the heterogeneous information. This file is used in conjunction with a [MATName]_mdsMAT.dat file which contains the material model and is generated from Multiscale Designer directly. This is the anisotropic information. In total, both files allow for heterogeneous anisotropic structural simulations of reinforced injection molded parts. In OptiStruct, use a MATMDS material definition, where AMAT = [MATName]_mdsMAT.dat, the OPTION = FIBER, and the AOPT = [FOTName]_mdsFOT.dat. For other solvers, these files will be used in that solver's respective “User Material” card. For other solvers, reference the Multiscale Designer documentation for details on using these files.
- [FOTName].hwascii
Visualize Mapped Fiber Orientation Tensors for Qualitative Assessment
- In HyperMesh, add a page, and make that page a HyperView client.
- Enable a 2-window layout for the new HyperView page.
- In the left window, load the mold mesh (*.fem, *.inp) and the mold fiber orientation tensor results [FOTName].hwascii.
- In the right window, load the structural mesh [FOTName]_StructualMesh_MoldSpace.fem and the mapped fiber orientation tensor results [FOTName]_mdsFOT.hwascii.
-
With both models and results loaded, you can contour any fiber orientation
tensor component and sync the displays for a qualitative assessment of the
mapping quality
Figure 15. HyperMesh (HyperView) Visualization of Mapped Fiber Orientation Tensors 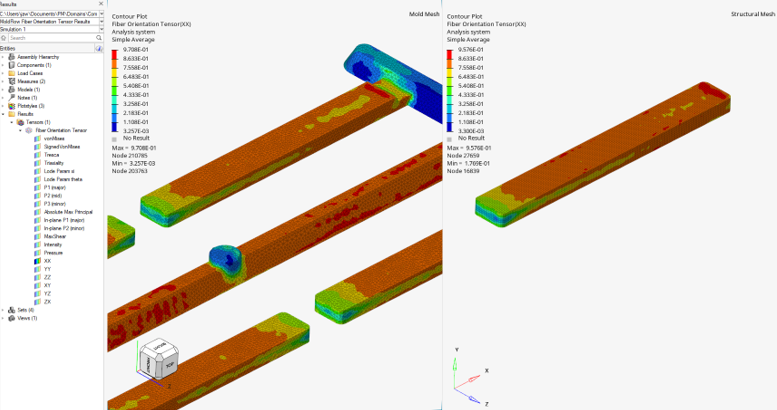
Plot Histogram Data for Qualitative Assessment
- In HyperMesh, add a page, and make that page a HyperGraph client.
- Enable a 2-window layout for the new HyperGraph page.
- In each window, define a new curve of source type file and select the [FOTName].csv file for mold mesh histogram data and [FOTName]_mdsFOT.csv for structural mesh histogram data.
-
To plot a histogram for any specific fiber orientation tensor component, simply
select the x-component as Increament1, and the y-component as the fiber
orientation tensor component of interest to plot (a11, a22, a33, a12, a23,
a13).
Example histograms for a11 (left window) and a22 (right window) are shown below, where the blue line is the mold mesh histogram, and the red line is the structural mesh histogram.Note: If plotting a histogram for the shear fiber orientation components (a12, a23, a13), select the x-component as Inxcreament2.
Figure 16. HyperMesh (HyperGraph) Plot of Histogram Data 
Assign Material Orientation to Structural Mesh

Create and Assign the Multiscale Heterogeneous Anisotropic Material
-
Create an ASSIGN card, which defines a variable for each of the following
files:
- [MATName]_mdsMAT.dat
This file is generated in the multiscale material model develop process within Multiscale Designer. Consult the Multiscale Designer documentation for details on developing a multiscale material model if one is not already provided.
- [FOTName]_mdsFOT.dat
- [MATName]_mdsMAT.dat
-
Create a MATMDS card which points to the two files above as:
- AMAT = variable assigned to [MATName]_mdsMat.dat
- OPTION = FIBER
- AOPT = variable assigned to [FOTName]_mdsFOT.dat
-
As standard FEA procedure, assign the material to an appropriate ply or
property for a specific solver.
A multiscale heterogeneous anisotropic structural simulation model is now defined.