View the optimisation results obtained by OPTFEKO.
The graphs have already been configured to view the
progress of the optimisation process.
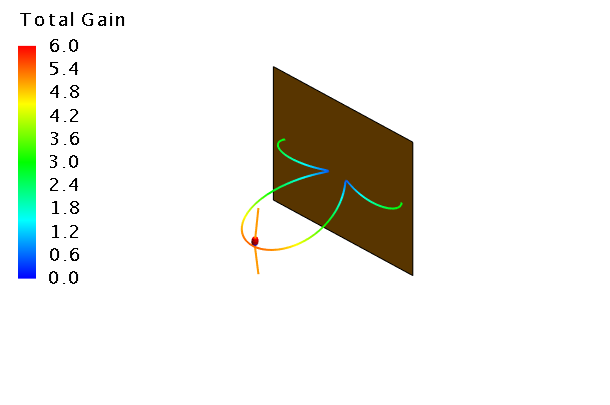
View the final results of OPTFEKO for the
optimisation parameters on the previously defined 3D view
and 2D graphs.
Figure 1. The optimisation run number on a Cartesian graph.
Note: For more details on the optimisation process, view the log file,
Dipole_Optimisation.log, that was created in the
same directory as the current model.
OPTFEKO creates multiple CADFEKO (.cfx) models
for each iteration, located in the same directory as the current model. For
example: