Setting Up POSTFEKO to View Optimisation Progress
Create a 3D view with the far field results as well as two Cartesian graph to view the distance parameter and far field goal.
-
Display the far field in the 3D view.
-
On the Home tab, in the Add results group, click the
 Far field icon.
-
From the drop-down list select
FarField1.
Figure 1. The far field result for the bent dipole and plate. 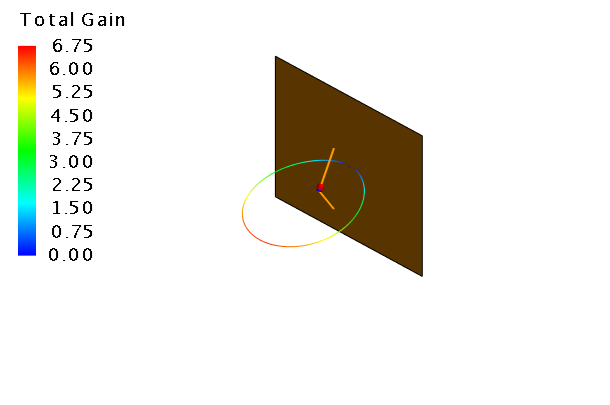
-
On the Home tab, in the Add results group, click the
-
Add a Cartesian graph and view the optimised parameter,
alpha.
-
On the Home tab, in the
Create new display group, click the
 Cartesian icon.
-
On the Home tab, in the
Add results group, click the
 Optimisation icon. From the drop-down list, select
Optimisation.
Optimisation icon. From the drop-down list, select
Optimisation.
-
In the result palette, in the
Trace list, select
alpha.
Figure 2. The Optimisation panel in the result palette. 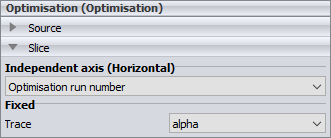
-
On the Home tab, in the
Create new display group, click the
-
Duplicate the first graph (to create a second graph) to view the optimised
parameter, d.
-
On the Cartesian
context tab, on the Display tab, in the Duplicate group, click the
 Duplicate view icon.
- In the result palette select the trace, Optimisation.
- In the result palette, in the Trace field, select d.
-
On the Cartesian
context tab, on the Display tab, in the Duplicate group, click the
-
Duplicate the first graph (to create the third graph) and view the far field
goal versus optimisation run number.
-
On the 3D View
contextual tabs set, on the Display tab, in the
Duplicate group, click the Duplicate view icon.
- In the result palette select the trace, Optimisation.
- In the result palette, in the Trace field, select search1.goals.farfieldgoal1.
-
On the 3D View
contextual tabs set, on the Display tab, in the
Duplicate group, click the
-
[Optional] Arrange (tile) the four windows to view the multiple windows at
once.
-
On the View tab, in the
Window, click the
 Tile icon.
-
On the View tab, in the
Window, click the