
Python Plots
Python distributed with Compose includes two plotting packages: Matplotlib and Plotly.
Matplotlib Plots
A Matplotlib plot can be an inline plot (default), use of one of the available matplotlib backends, or be displayed in a Compose docked or undocked window using the custom Compose backend.
To open the Matplotlib plot in a Compose window, select (or Docked window).
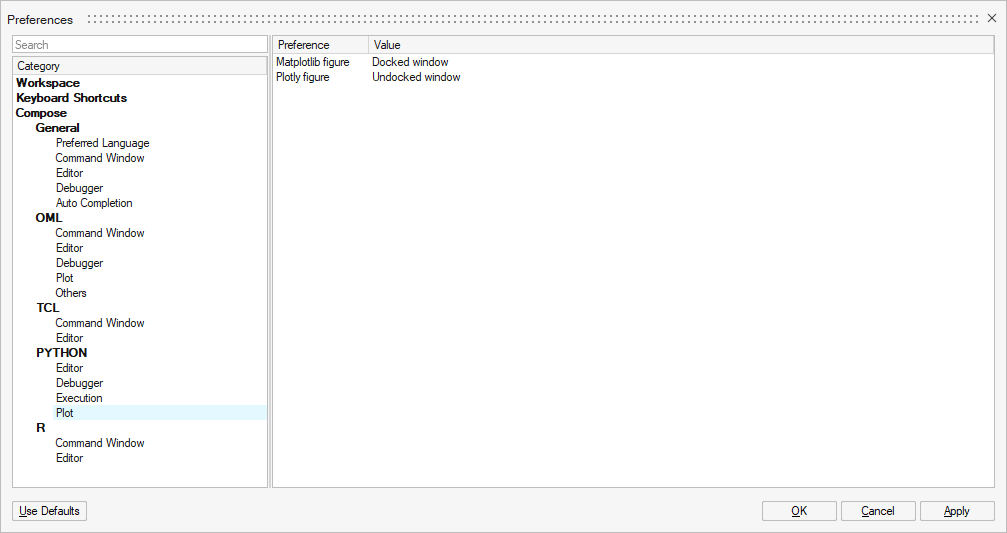
Plotly Plots
A Plotly plot can be shown in the browser (default) or in a Compose docked or undocked window.
To open the Plotly plot in a Compose window, select .
Python Plots in Compose Undocked Window
If the Undocked window option is selected for Matplotlib or Plotly, then new plots of this library are shown in an undocked window. If the Docked window option is selected, then new plots are shown in the Views browser.
Example using Matplotlib:
import matplotlib.pyplot as plt
import numpy as np

x = np.linspace(0, 10,50);
plt.plot(x, np.cos(x))import plotly.graph_objects as go
import numpy as np
x = np.linspace(0, 10,50);
fig = go.Figure()
fig.add_trace(go.Scatter(x=x, y=np.cos(x)))
fig.show()
New plots are visible in the Project Browser .
- 'Show': Shows the plot
- 'Hide': Hides the plot
- 'Delete': Deletes the plot
- 'Rename': Renames the plot
- 'Copy': Copies the plot’s image to clipboard
- 'Save As Image': Saves the plot as an image. The following image file
formats are supported for each library:
- Matplotlib: .eps, .jpeg, .jpg, .pgf, .pdf, .png, .ps, .raw, .rgba, .svg, .svgz, .tif, .tiff
- Plotly: .jpeg, .png
Comments
As per Matplotlib’s documentation, to export an image as .pgf “requires a recent LaTeX installation that includes the TikZ/PGF packages (such as TeXLive), preferably with XeLaTeX or LuaLaTeX installed. If either pdftocairo or ghostscript is present on your system, figures can optionally be saved to PNG images as well. The executables for all applications must be located on your PATH.”