Edit Properties of Plots
In Compose, you can edit the properties of plots created with OML plotting commands.
Interacting with the User Interface: Plot View Mode
Creating and handling plots is introduced in tutorial Compose-1000. The Compose application allows you to manipulate plots in the plot view to interactively change plot properties.
In plot view, you can interact and manipulate the plot using the following methods:- Ctrl + Mouse left button dragging: Pan the plot.
- Mouse wheel rolling up/down: Zoom in/out the plot.
- If the mouse is on the X (resp. Y) axis, it will only zoom on the X (resp. Y) axis.
- Middle mouse button (mouse wheel) click: Reset plot view.
- Middle mouse button (mouse wheel) dragging: Circle zoom in plot.
- Ctrl + Middle mouse button (mouse wheel) dragging: Box zoom in plot.
- Mouse right-button click: Displays context menu Edit... option to open the Figure Browser. See Figure Browser
- F key press: Reset plot view (same as Middle mouse button)
Figure Browser
Dialog to graphically edit the visual properties of plot elements.
The Figure Browser dialog allows you to graphically edit the style properties of figure and plot elements. The dialog contains the Figure browser tree and the Property editor.
Figure Browser tree
The Figure browser tree displays the figure elements in a hierarchical order. The hierarchy of elements is:
- Level 0: Figure element.
- Level 1: One or more subplot elements.
- Level 2: The contents of the subplot. The elements in this level depend on the type of
the subplot. Level 2 element are:
- Data (curve, surfaces)
- Text (text boxes created by the text command)
- Legend
- Colorbar (only if the subplot supports a colorbar)
- Axis element (an element for each axis of the plot)
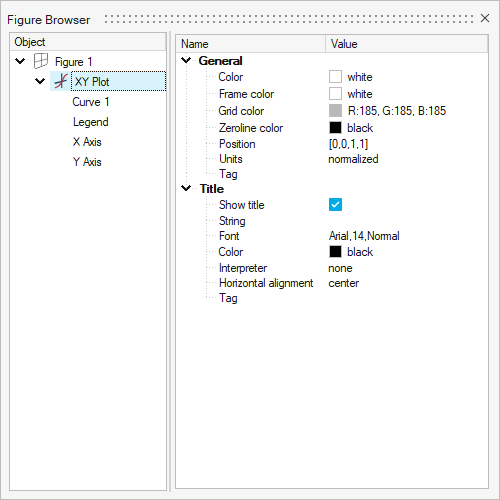
Below is an example of the Figure Browser tree for the following figure: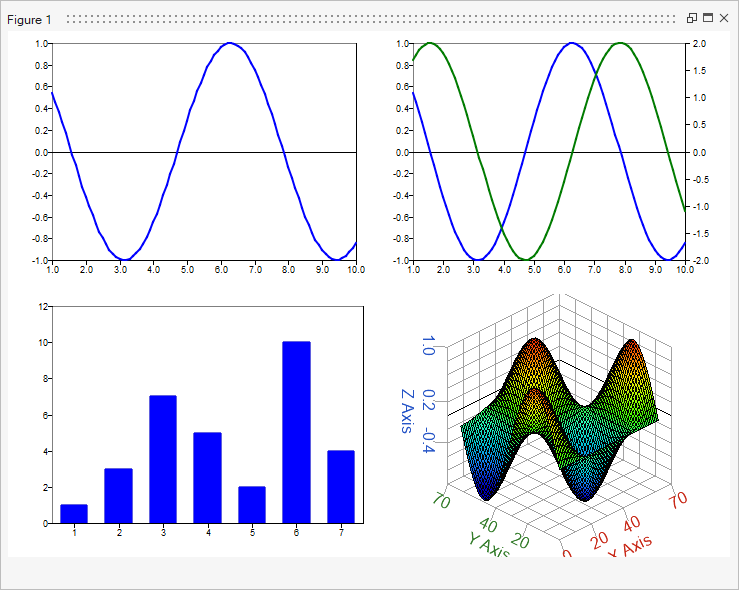
The Figure Browser tree for this figure contains four subplots in Level 1. The subplots are named based on their type. If two or more subplots of the same type exist in the figure, their index number, based on the order of creation, is added to the name.
In Level 2 of this tree, each subplot has elements for the plotted data (Curve 1, Curve 2, Bar 1, and Surface 1). All subplots have elements for X and Y Axis. XY Plot 2 has an additional axis element (Y2 Axis) for the secondary Y axis and 3D Plot has an additional Z Axis element. The 3D Plot also has an element for the Colorbar.
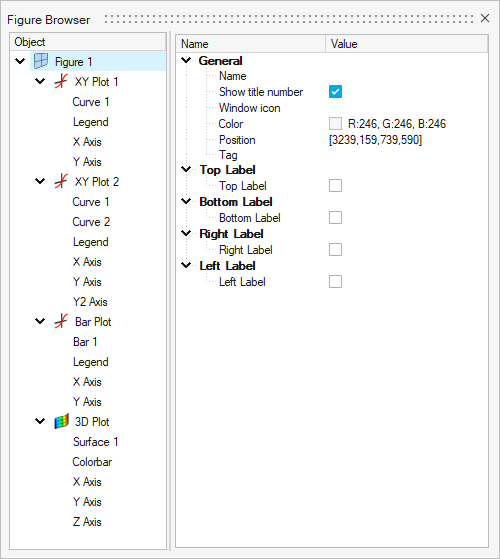
Property editor
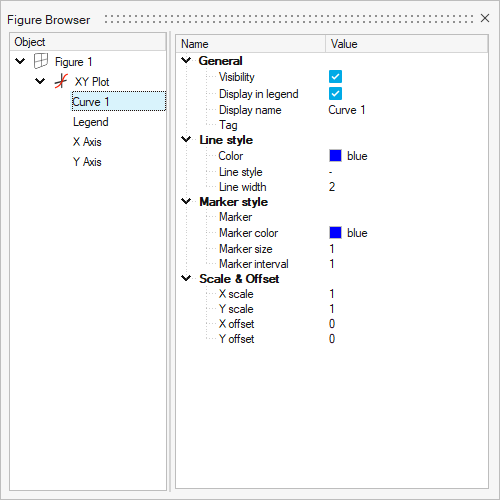
The Property editor contains the properties of the selected element in the Figure Browser tree. The first column shows the name of the property, and the second column shows the current value of the property.
Click on the second column property value to change it. The new value is immediately applied to the plot.
The Property editor displays a subset of the properties available for each element. For a full list of properties please see Graphics Object Properties.
Accessing the Figure Browser
To open the Figure browser right-click on the plot area and click
Edit....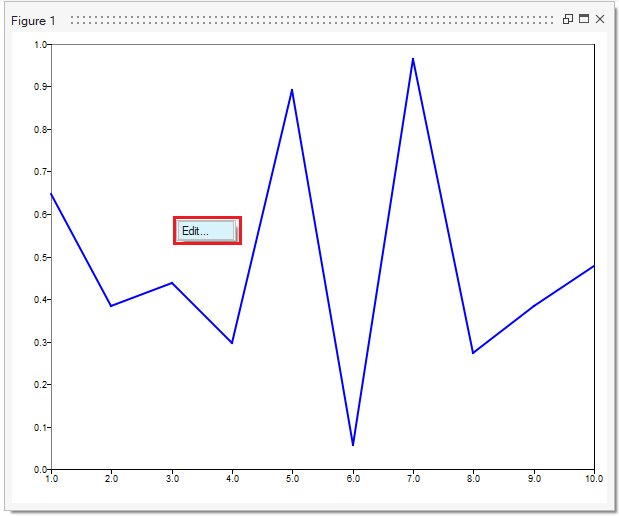
To directly edit the properties of an element, for example a curve, hover over the element,
right-click and select Edit.... The Figure Browser opens with that
element already selected.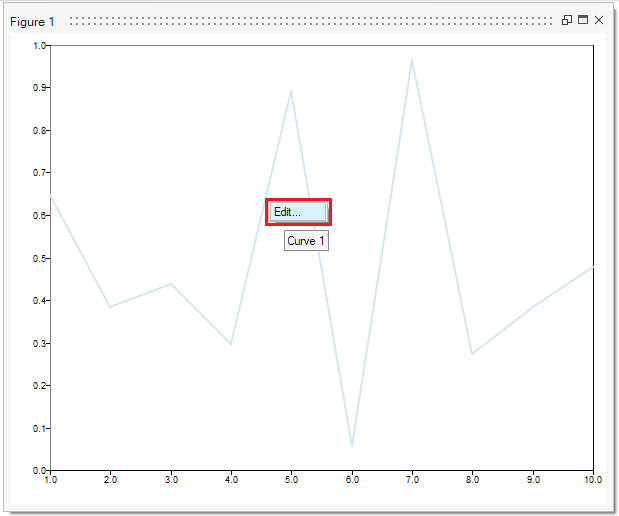
Edit Colorbar
You can use the Edit Colorbar dialog box to edit the properties of the colorbar.
To edit the colorbar, right-click on the colorbar and then click Edit... to open the Figure Browser with the colorbar element selected.

The Property editor in the Figure Browser displays the basic properties of a colorbar. Click on the Advanced settings icon to open the Edit Colorbar dialog.

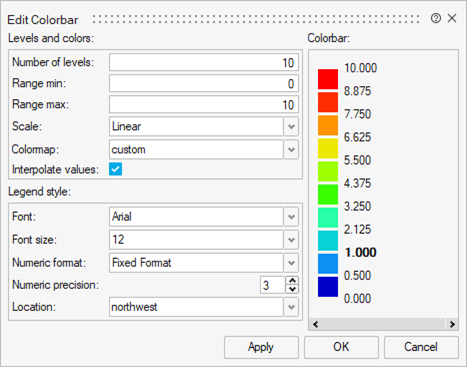
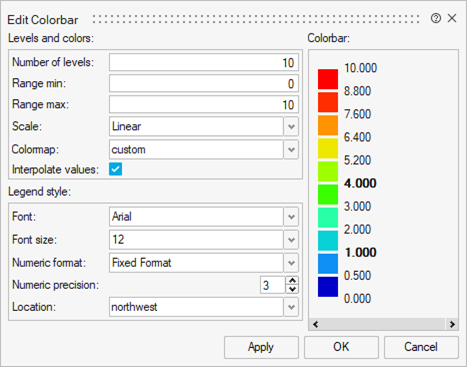
The Edit Colorbar dialog displays the advanced settings of the colorbar.

The dialog box contains three sections:
- Levels and colors: Properties to setup the levels and colors
- Legend style: Properties to format the colorbar ticks
- Colorbar: Preview of the colorbar levels, colors, and tick format.
Levels and colors
The following table contains a description of the properties in this section.
| Levels and colors | Description |
|---|---|
| Number of levels | Set the number of levels in the colorbar. The maximum number of levels is 500. |
| Range min | The minimum value of the colorbar. |
| Range max | The maximum value of the colorbar. |
| Scale | Select the colorbar scale. Options are Linear, Logarithmic, db10, and db20. |
| Colormap | Select one of the predefined colormaps. |
| Interpolate values | If selected, the colorbar values are interpolated when edited. |
Legend style
The following table contains a description of the properties in this section.
| Levels and colors | Description |
|---|---|
| Font | Select the colorbar tick labels font name. |
| Font size | Select the colorbar tick labels font size. |
| Numeric format | Select the numeric format. Options are Scientific and Fixed Format. |
| Numeric precision | Select the numeric precision of the colorbar ticks. |
| Location | Select the location of the colorbar. |
Changes to the Font style, Font size, and Location are not visible in the colorbar preview.
Colorbar
This section contains a preview of the colorbar. The colors and level values are editable.
To change a color, click on the color icon and select one of the available colors.

To change a level value, click on the value and type the desired one.

If the Interpolate values option is selected and a colorbar value changes (val1), the values between val1 and the colorbar’s min and max values are interpolated. If a second colorbar value changes (val2), then the interpolation is performed on the values between val1 and val2, and between val2 and the colorbar’s min or max value.
For example, in a colorbar with min = 0, max = 10, and 10 levels, the Interpolate values option is selected and the third value is changed to 1. The values between the min and third value and the values between the third value and max have been interpolated. The edited value is in bold

In the following image, the sixth value has been changed to 4, so now the values between the third and sixth value, and the values between the sixth value and max have been interpolated.
If the Interpolate values option is not selected, the values in the colorbar remain the same but any further edits do not trigger an interpolation.
Figure Toolbar
The Figure toolbar provides commonly-used plot actions.
Toolbar Actions
The toolbar is shown by default if the figure contains a plot, and it is hidden if a uicontrol is added.
To show or hide the toolbar, set the Figure property 'toolbar' to 'on' or
'off'.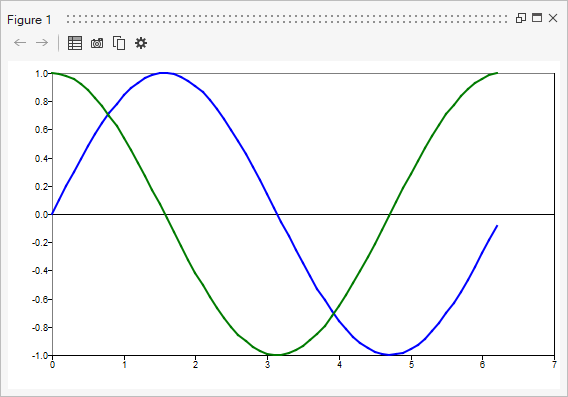
| Icon | Action | Description |
|---|---|---|
| Back | Go back to the previous view. Activated when zooming in the plot. | |
| Forward | Go to the next view. Activated when 'Back' button is pressed. | |
| Save data | Saves the plot data to a .csv or .mat file. Invokes a File browser dialog to select the file path, file name and file type to save. | |
| Save image | Saves the plot as an image. Invokes a File browser dialog to select the file path, file name and file type to save. | |
| Copy image | Copies the figure image to clipboard. | |
| Settings | Invokes the Figure browser dialog. |
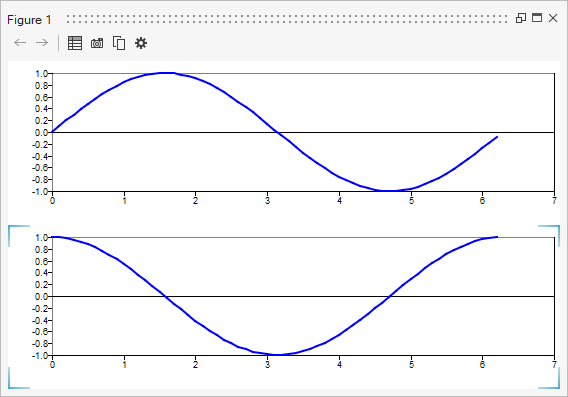
In the following image the second plot is the active plot: