
Create Plots
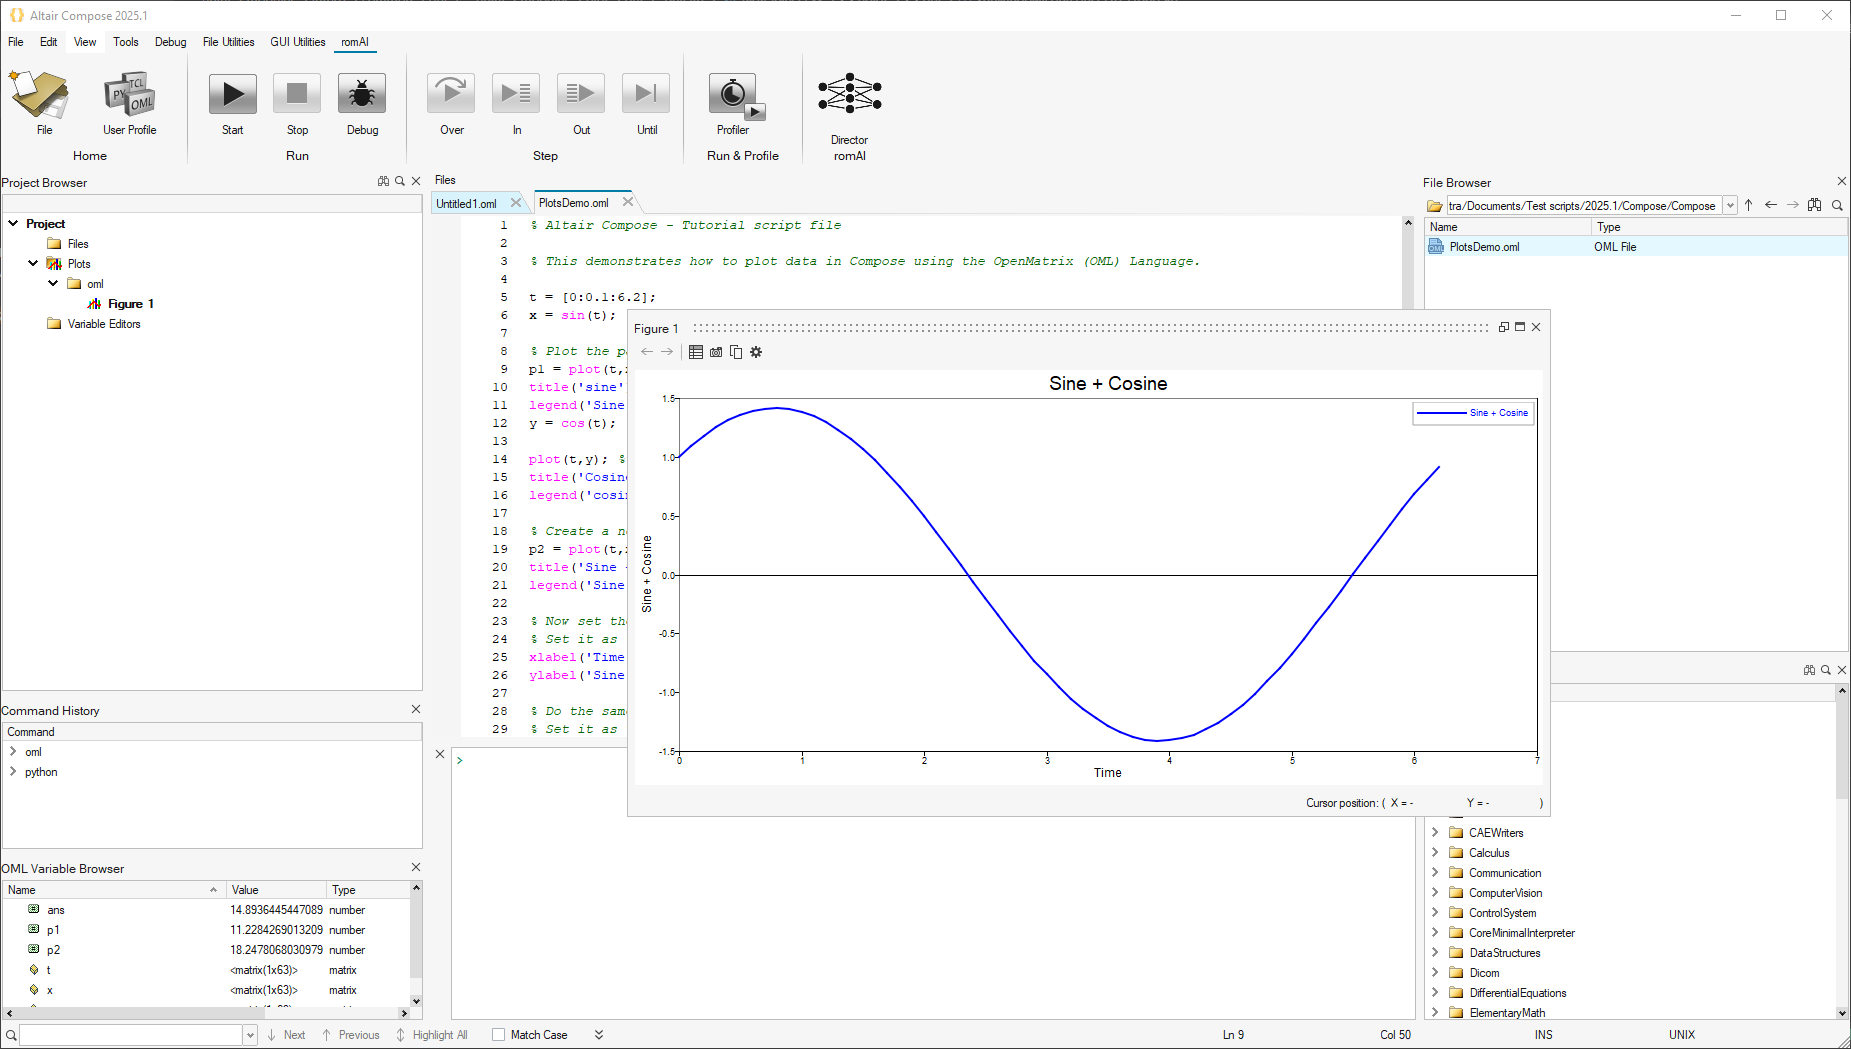
In Compose, you can create 2-D and 3-D plots using OML plotting commands.
OML Plots
In Compose, the OML language offers a rich set of plotting commands for both 2-D and 3-D plots.
Examples and syntax can be found in the section.
In Compose, 2-D or 3-D plots can either be displayed in the plot area, or they can be detached and floating.

To detach a plot, click this icon, ![]() , on the figure's top border:
, on the figure's top border:

By default, the plots are in the plot area. This can be modified in :

Plots (called figures) can be managed through the options on the context menu from the Project Browser:
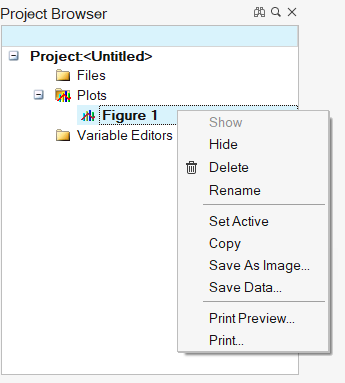
| Select this option | To do this |
|---|---|
| Hide/Show | Show/hide the plot that has been created. |
| Delete | Delete the plot. |
| Rename | Enter a new name for the plot. |
| Copy | Copy the plot to the clipboard. Press Ctrl+V to paste the plot into your desired application that accepts images. |
| Save As Image | Save the plot as an image .png or .bmp file. |
| Save Data | Save the data that is displayed in the plot (including subplots) as a .csv or .mat file. |
| Print Preview | View the plot as it will appear in a printed format. |
| Define print settings and print the figure. |
Plots in R
Compose supports R language plot commands.
The default option is to rely on the MATPLOTLIB implementation provided by R.
plot(table(rpois(100, 5)), type = "h", col = "red", lwd = 10, main = "rpois(100, lambda = 5)")
The second option is to leverage the PLOTLY library in R.
library(plotly)
x <- c(1:100)
random_y <- rnorm(100, mean = 0)
data <- data.frame(x, random_y)
p1 <- plot_ly(data, x = ~x, y = ~random_y, type = 'scatter', mode = 'lines')
pl