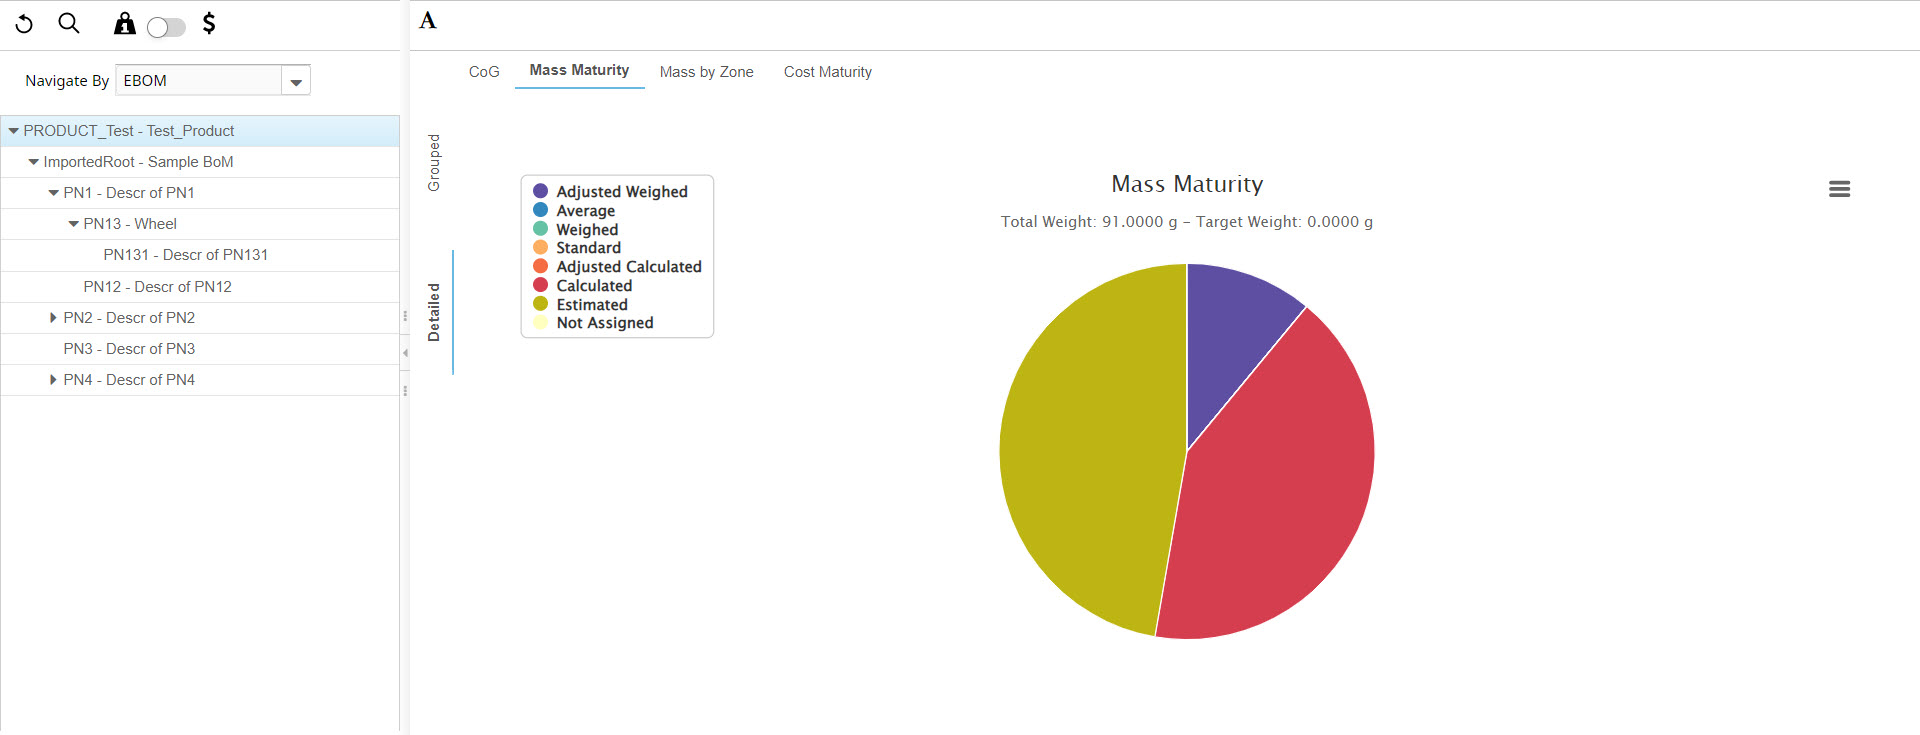
Mass Maturity Charts
You can view the detailed and grouped view of a selected Product in a Pie chart in the chart area.
-
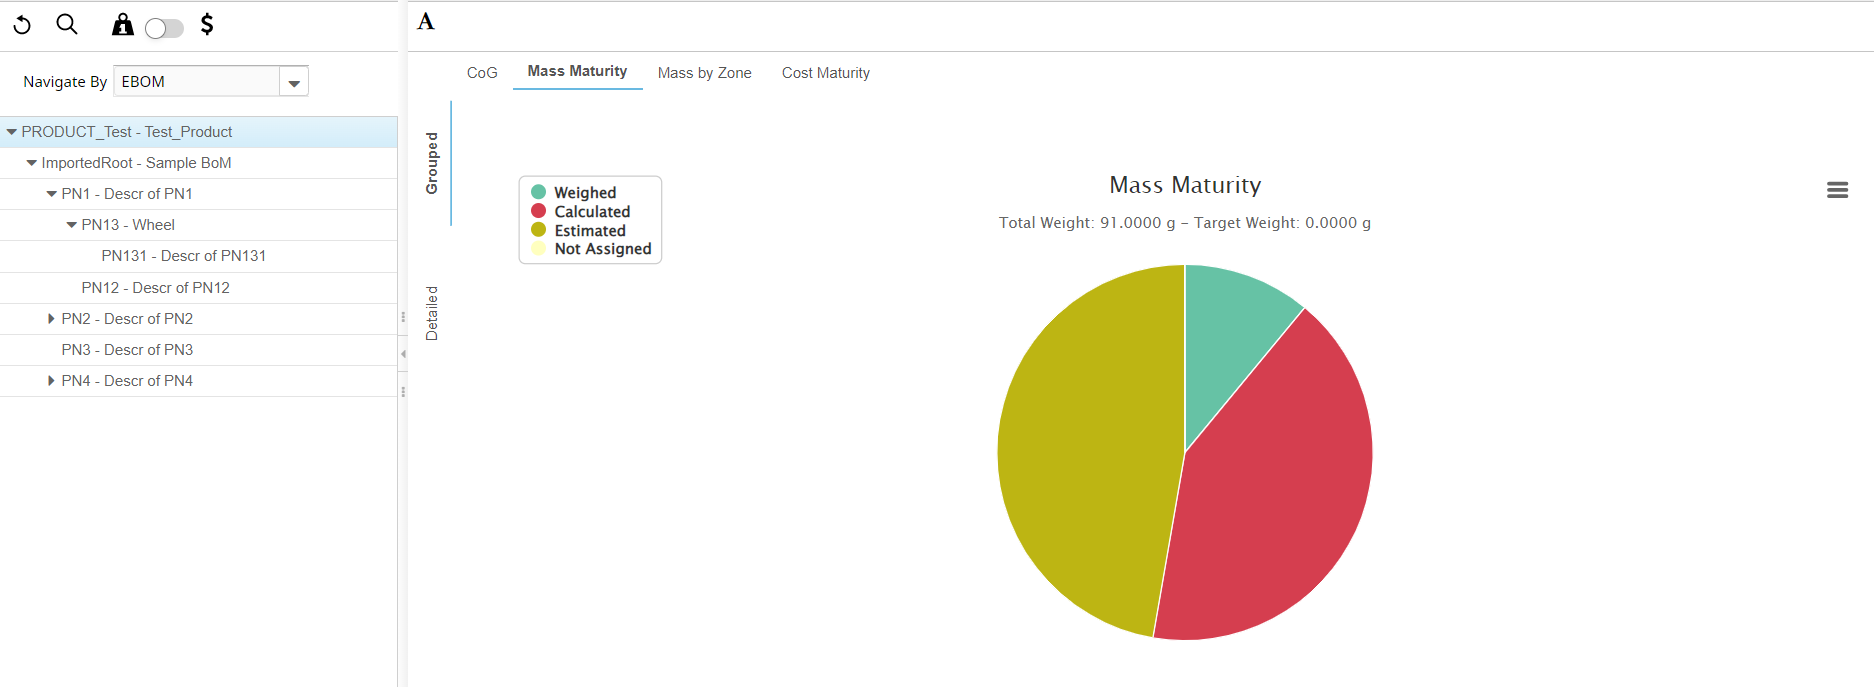
Select the Mass Maturity tab.
The detailed and grouped view of the selected Product is displayed in the chart area.
-
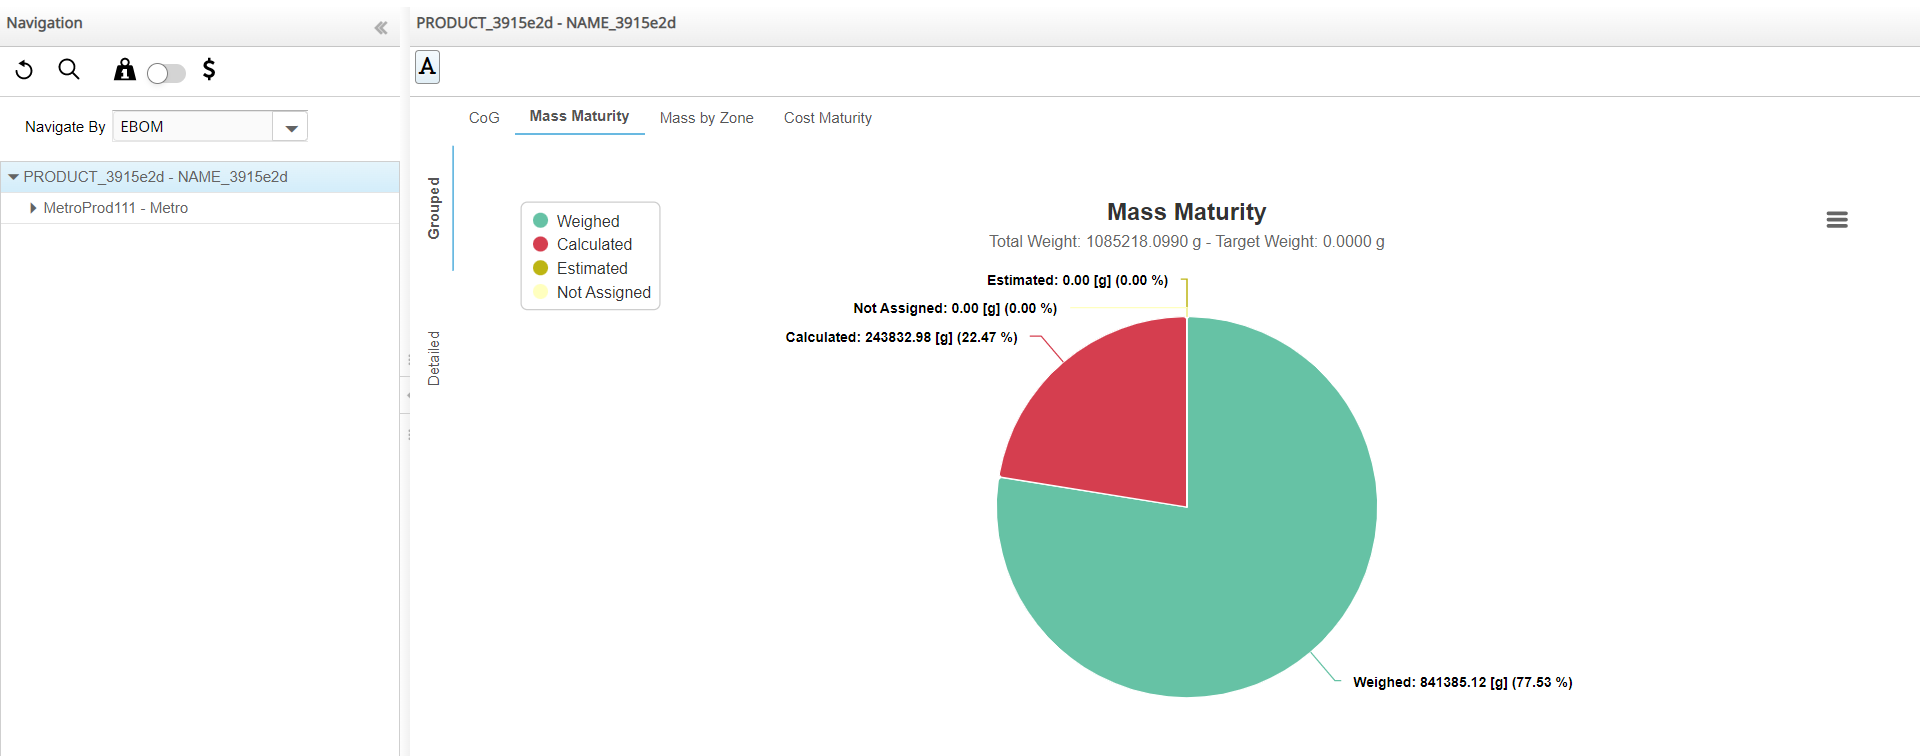
Click the
 icon to view the data labels.
-
Select any part from the Navigation panel.
The Pie chart is displayed with respect to the selected Product or part.
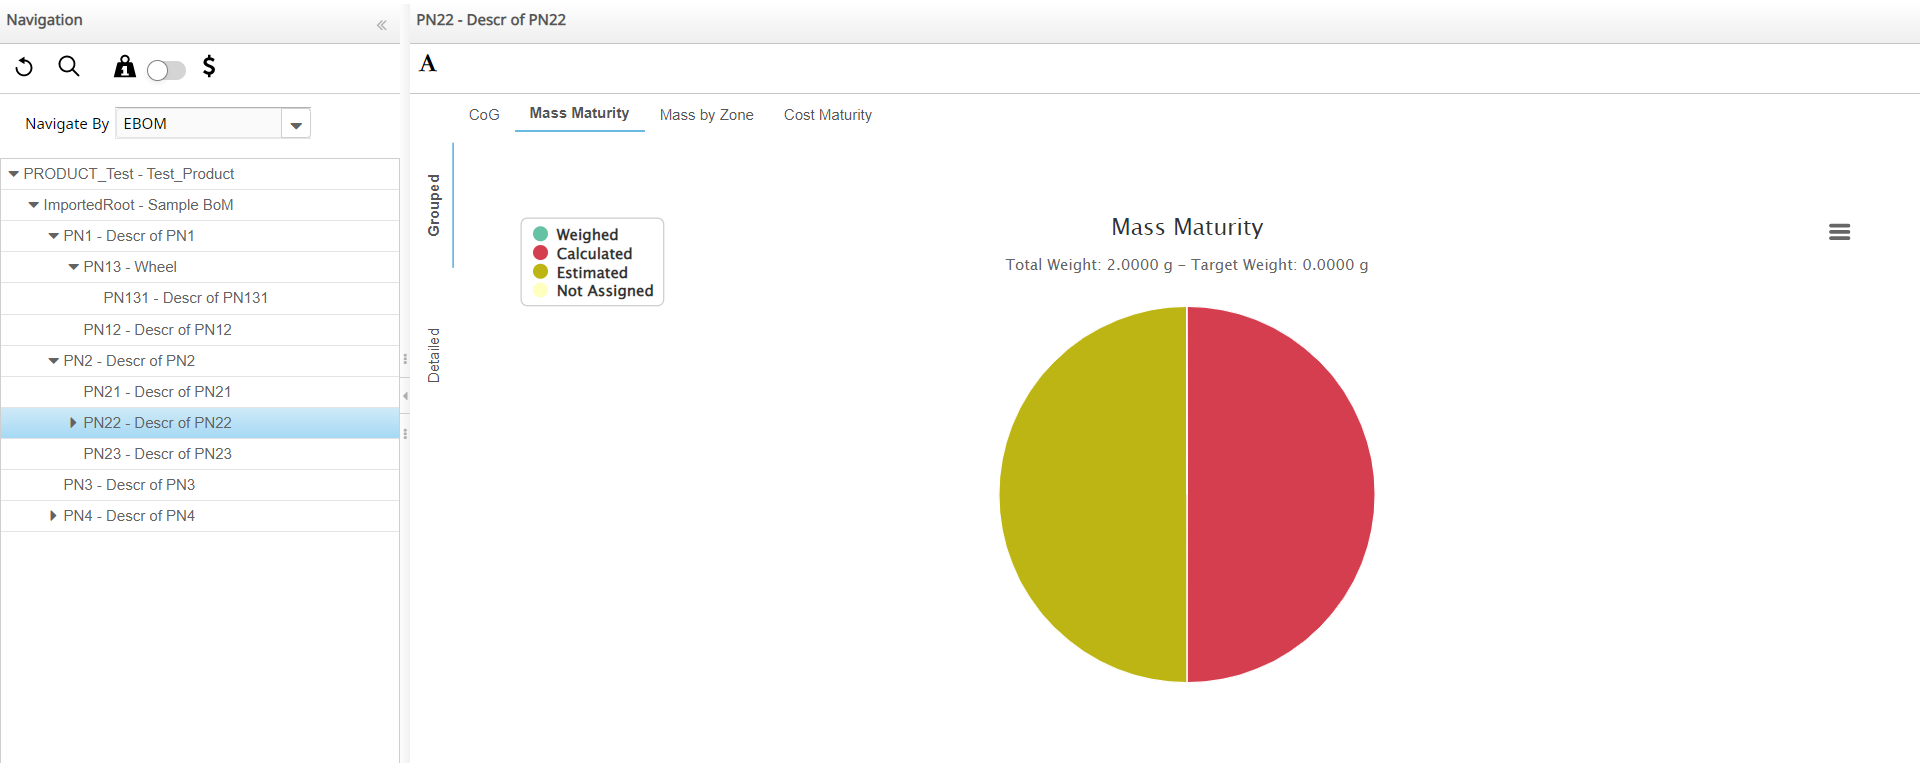 Note: The total weight of the part or Product selected in the navigation panel is displayed in the chart area.
 -
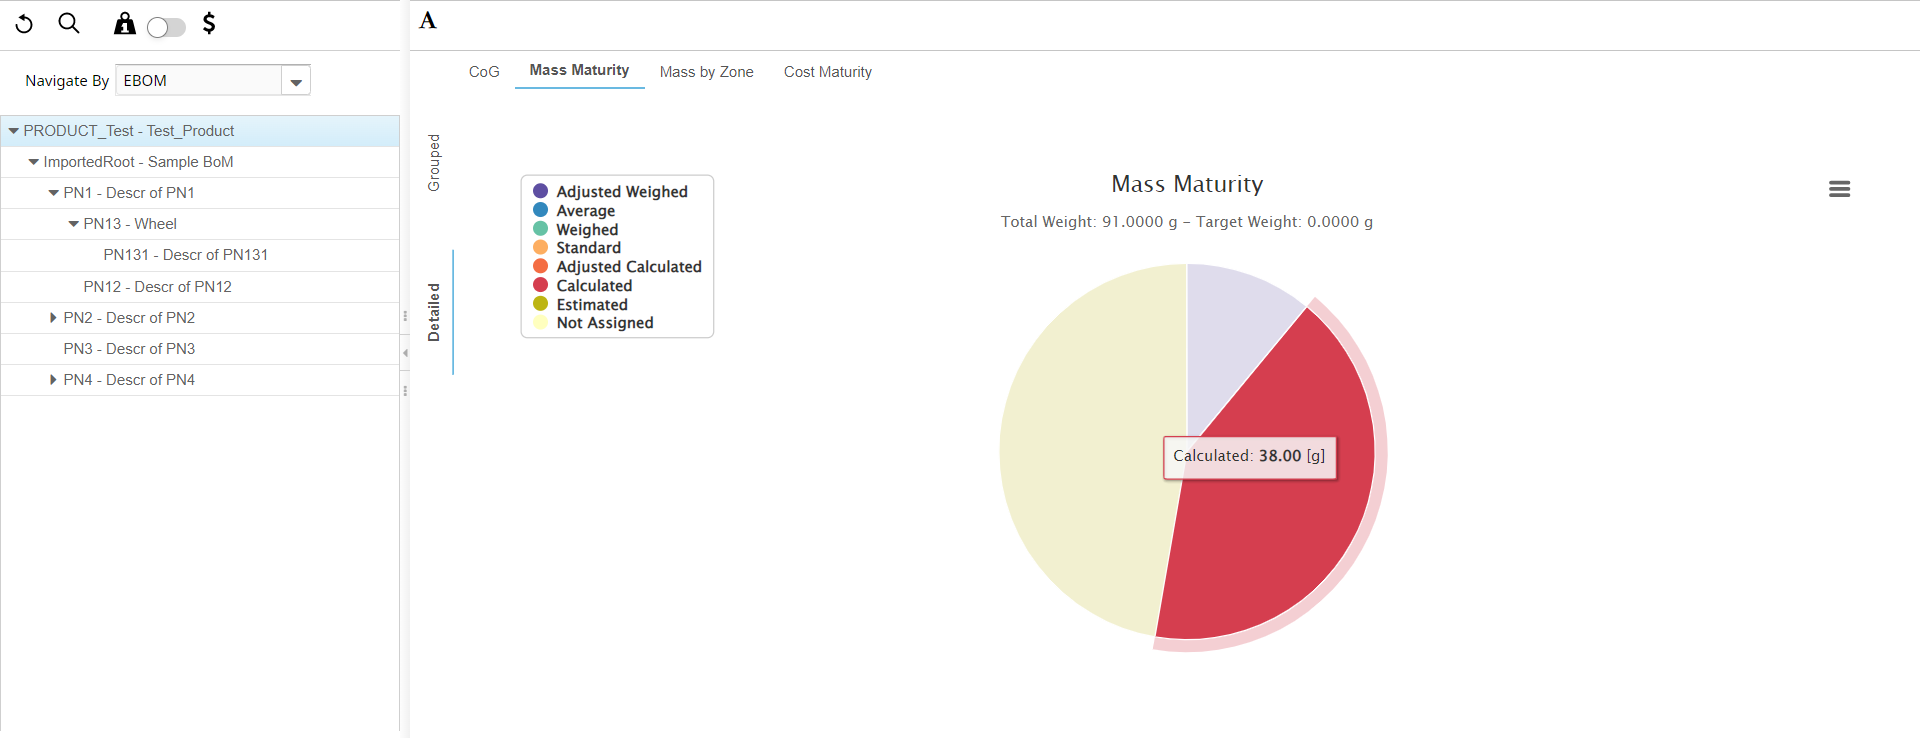
Select any of the options from the left with respect to the Mass Maturity chart to change the point of view.
Note: The Mass Maturity view is displayed in the Grouped and Detailed tabs. When the selected Product has managed the margin weights, the Mass Maturity chart displays these views as follows:
-
Click the Product legends to view the mass maturities or part.
 Note: Mouse over the legends to hide the respective mass maturities from the Pie chart.
 -
Place the mouse on any sector of the Pie chart.
The Total weight of the sector is displayed.