CoG Chart
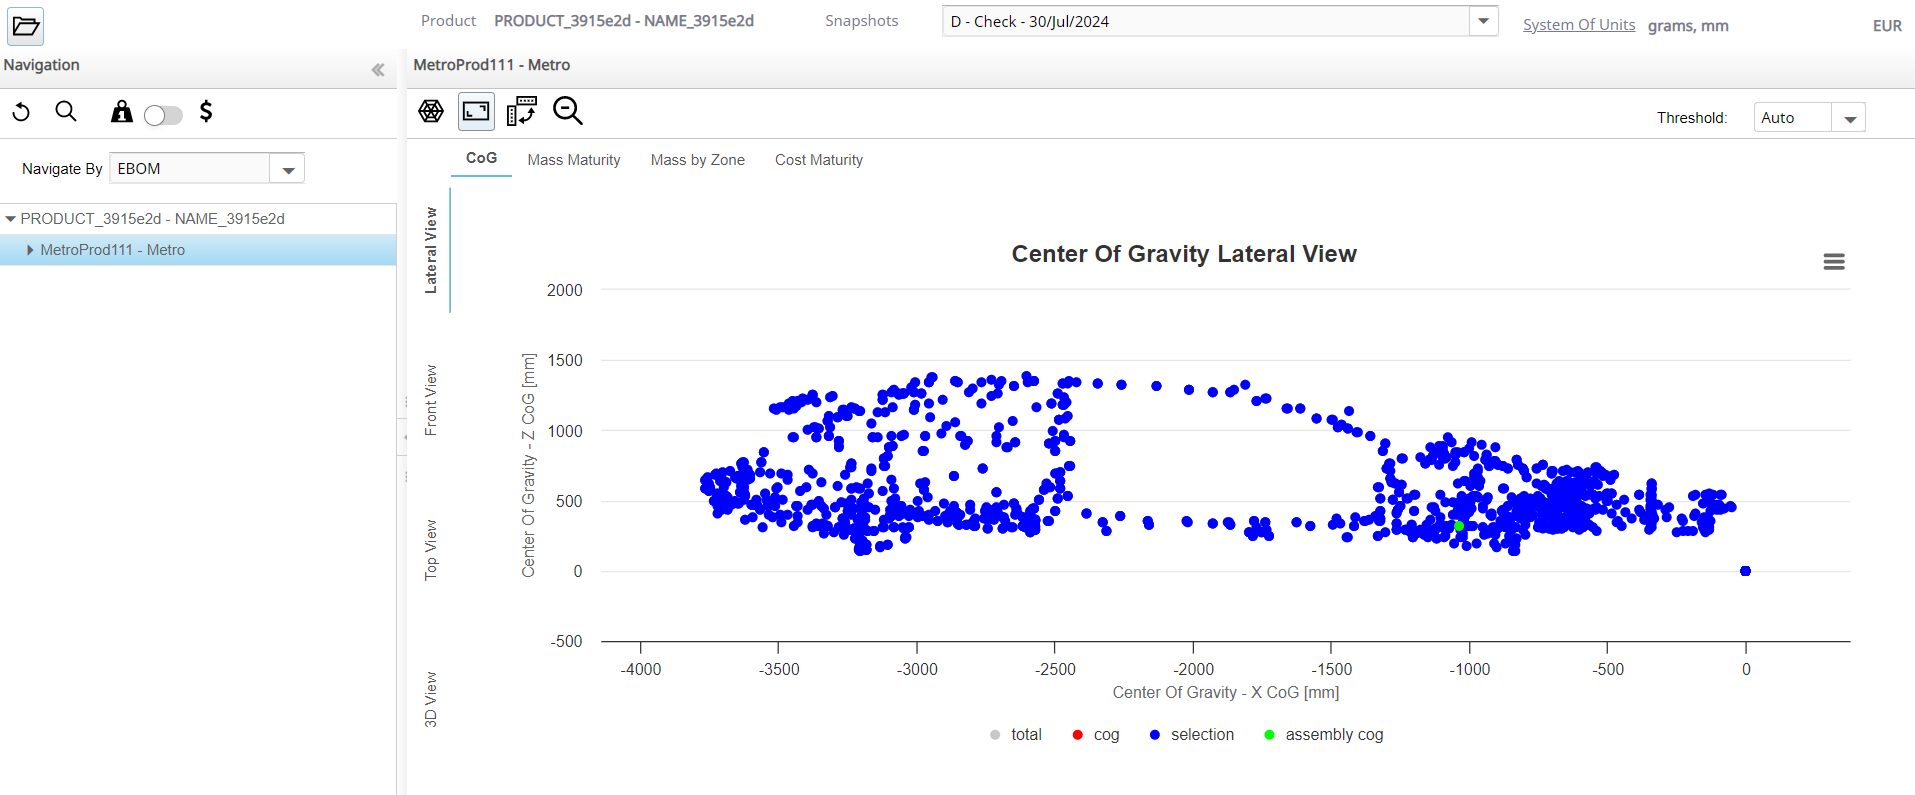
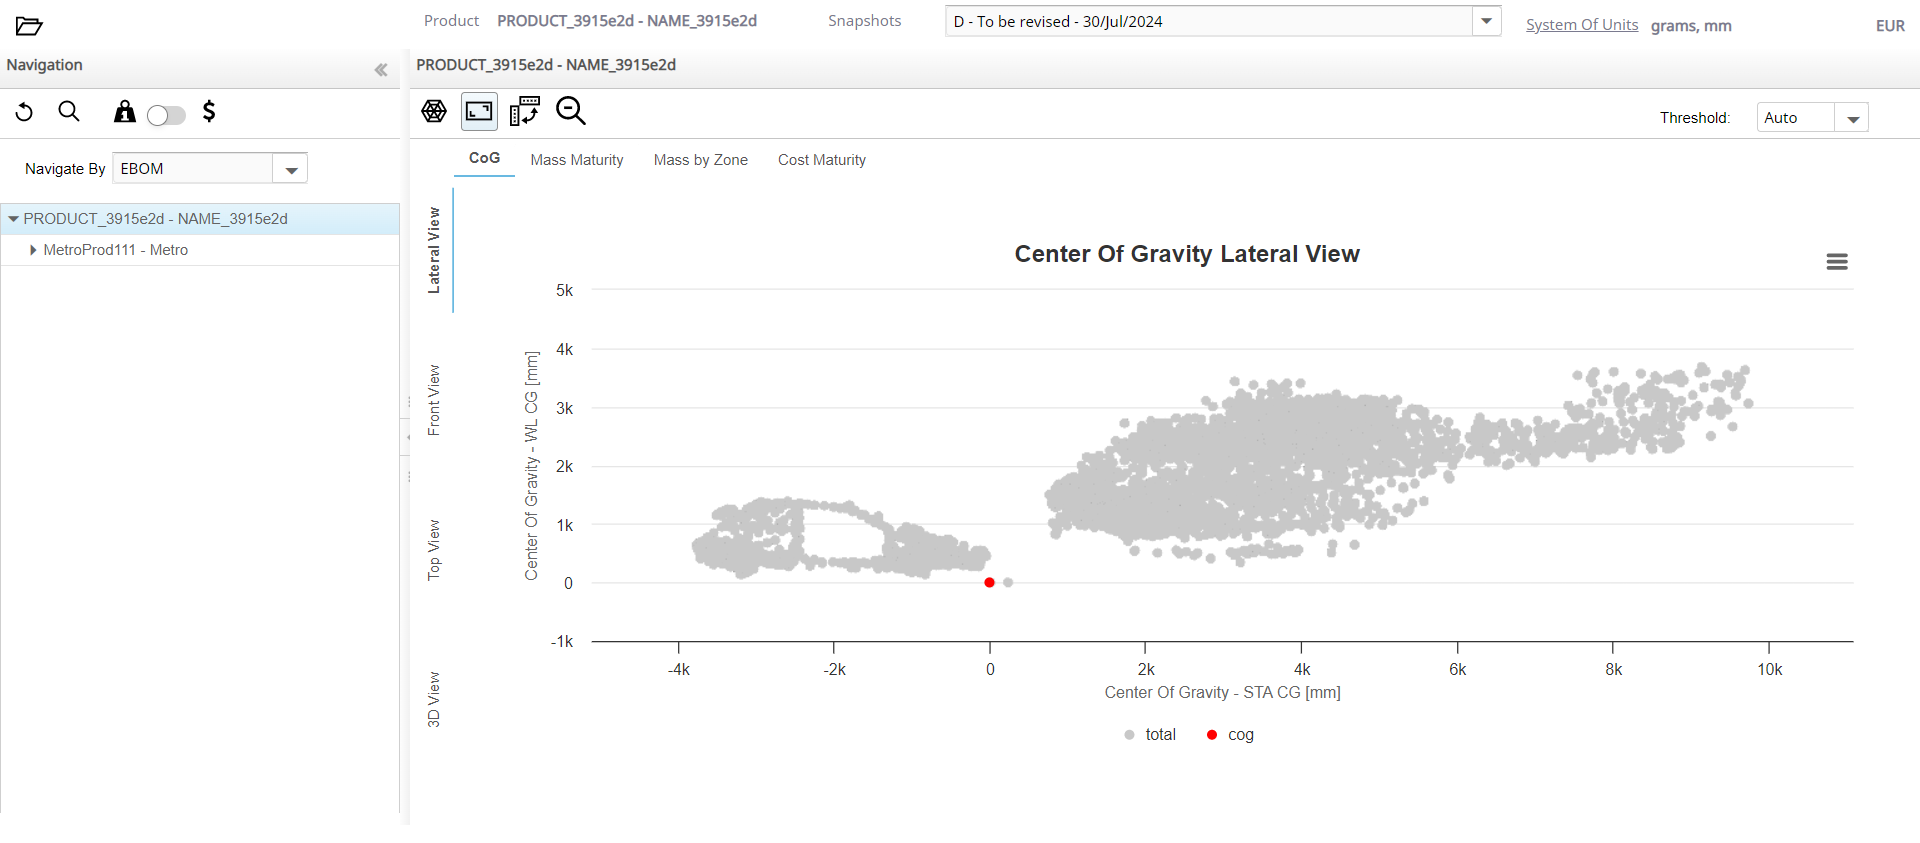
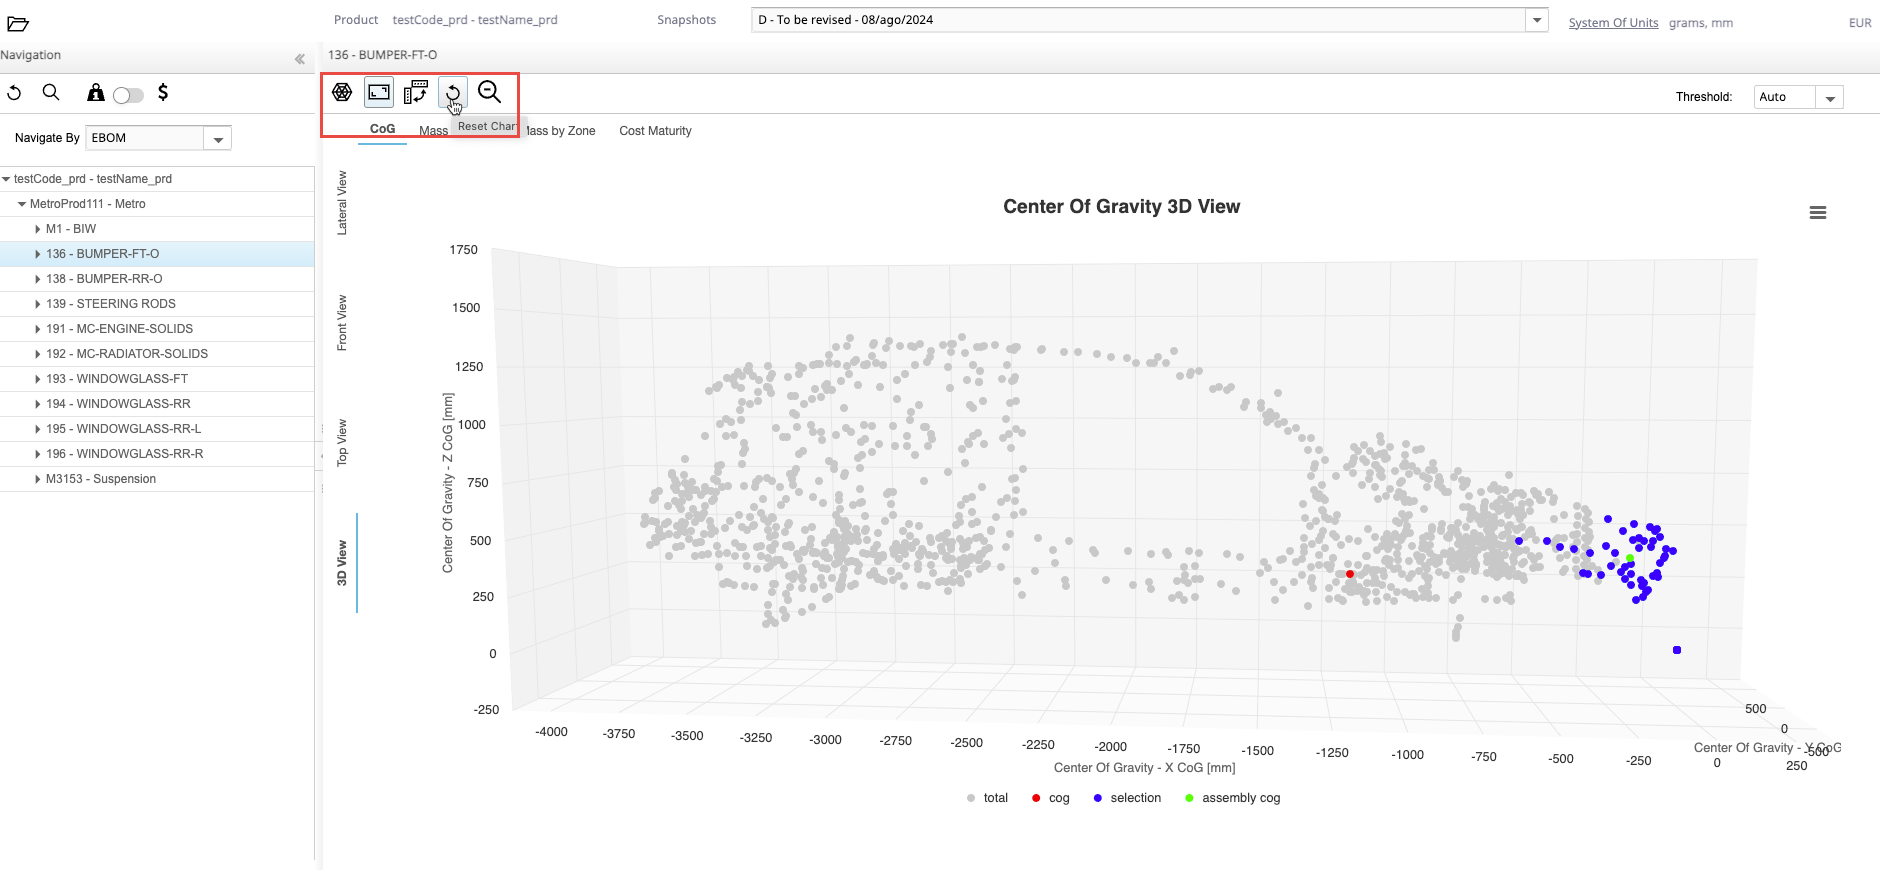
You can view the CoG chart in the Center of Gravity, Lateral View, Front View, Top View, and 3D View for the selected Part or Product in the chart area.
-
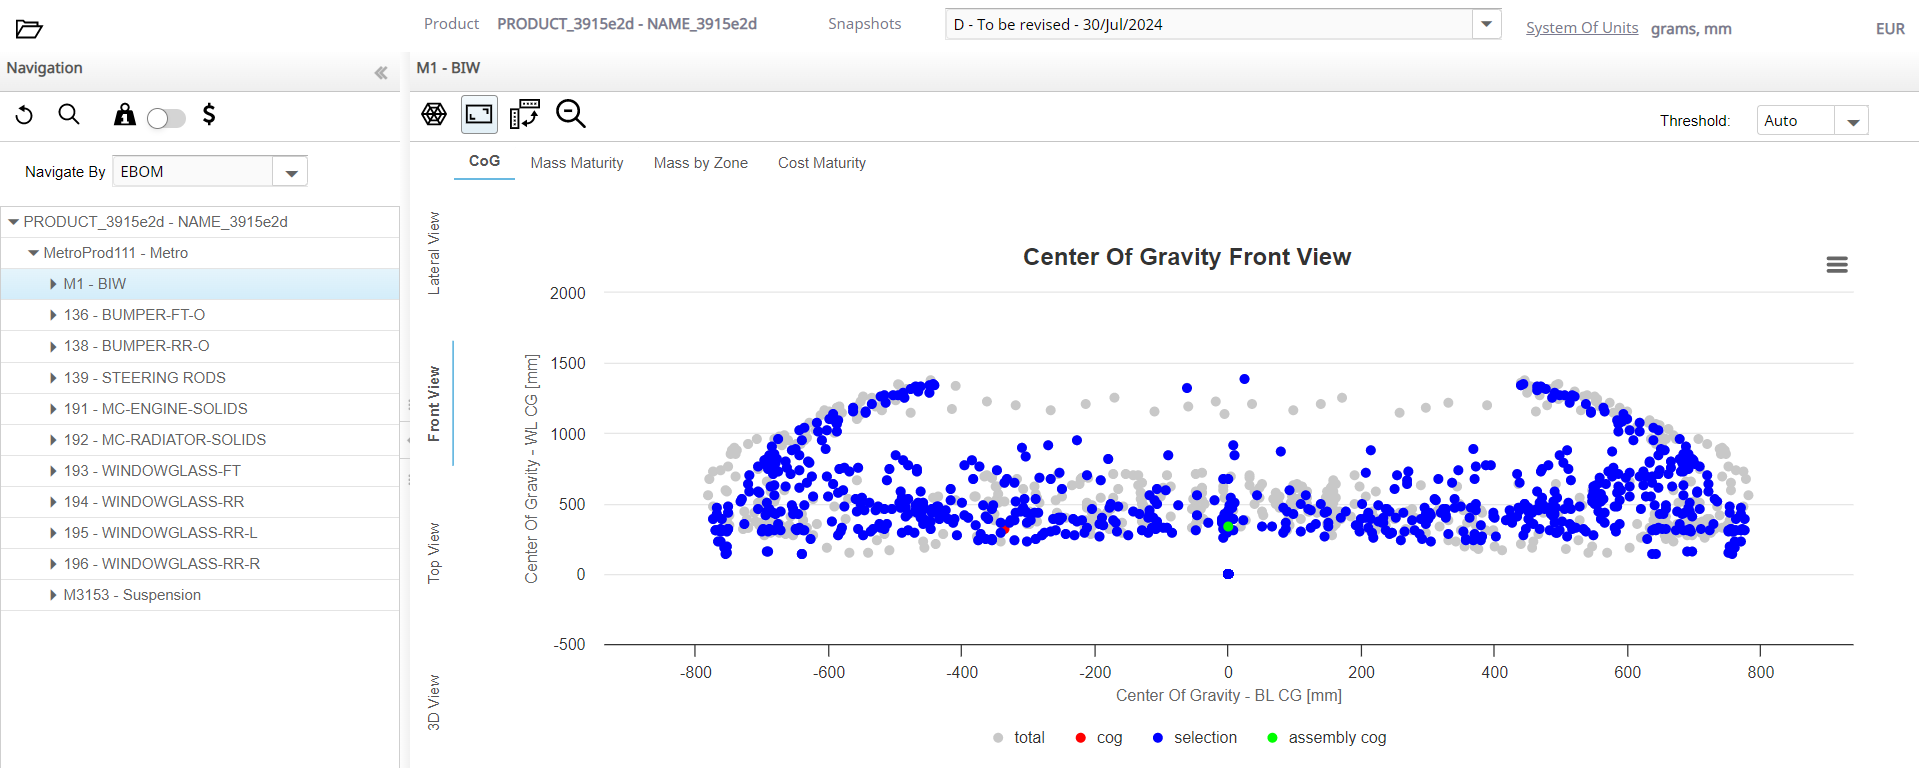
Select the CoG tab and then select any part from the
Navigation panel.
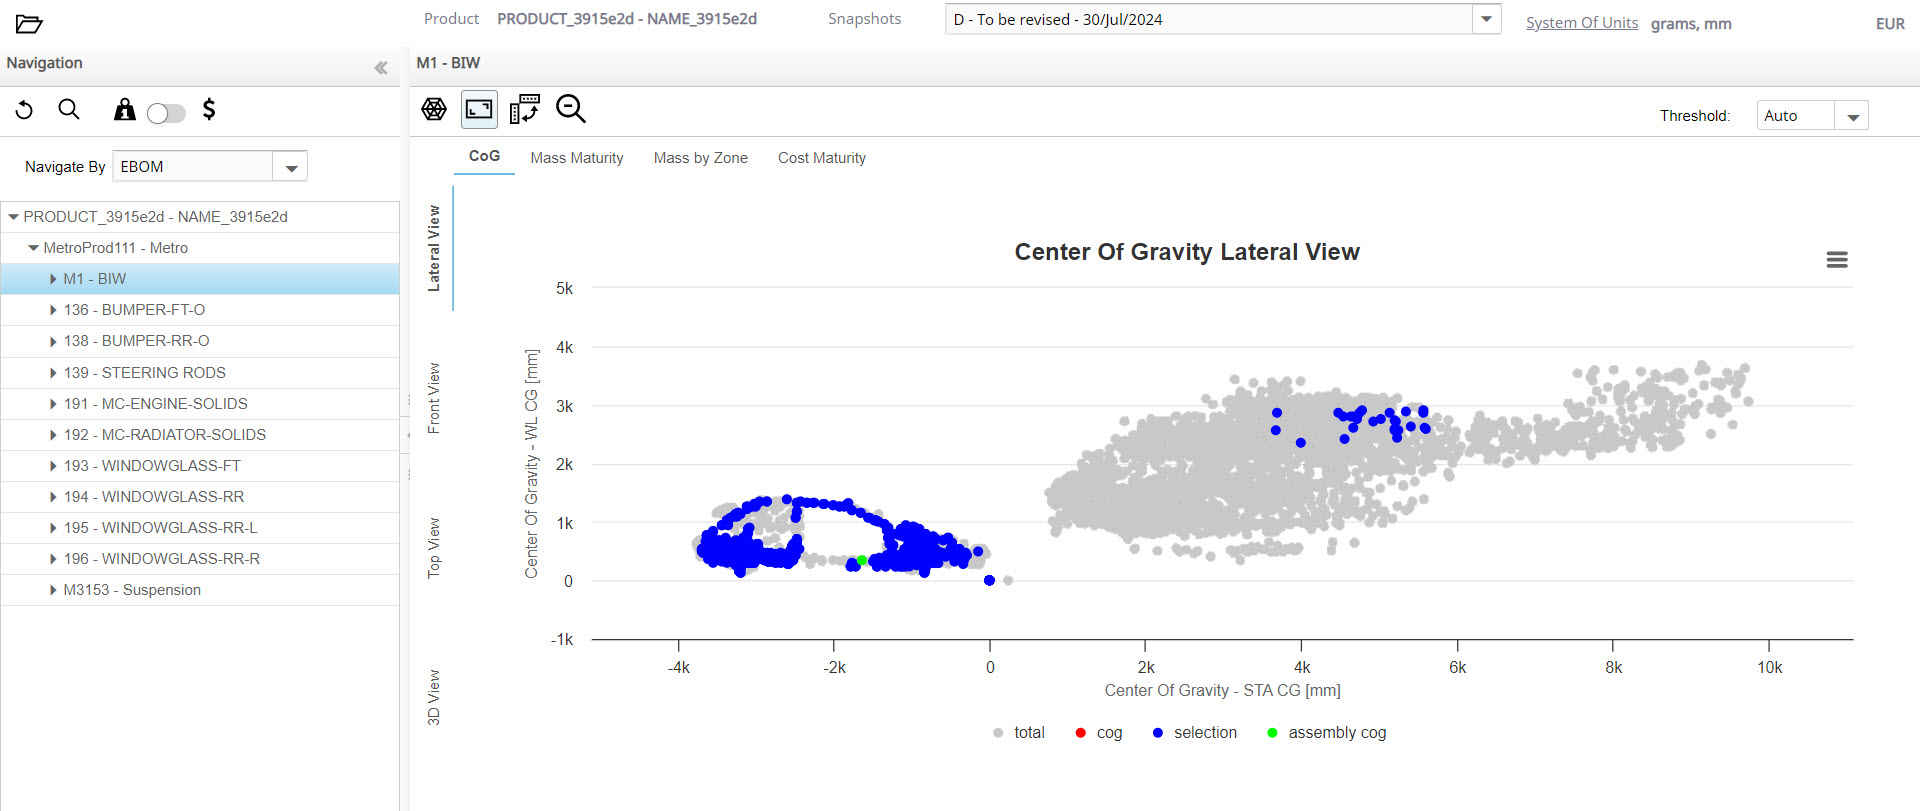
The part is highlighted with blue dots in the chart.
-
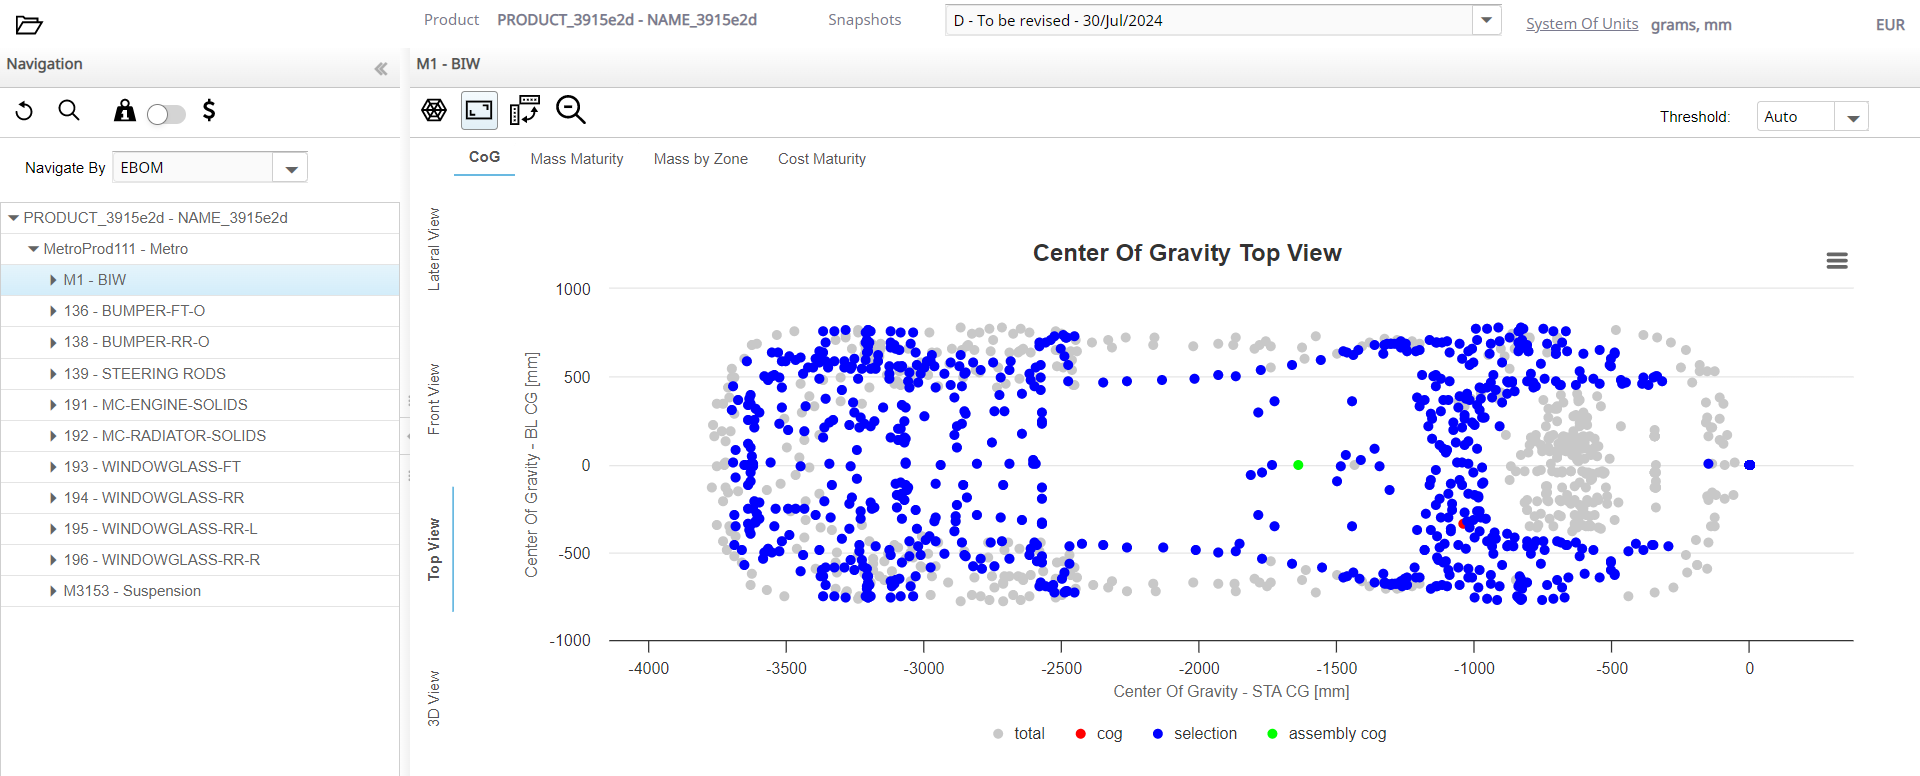
Select any part in the chart area.
The respective part is highlighted in the navigation panel.
 Note:
Note:- The red dot in the legend represents the Center of Gravity of all the parts in the Product.
- The green dot in the legend represents the Center of Gravity of the selected part.
-
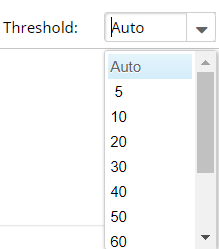
Select the required option from the Threshold dropdown list.
-
Select the tabs on the left to change the point of view.
The available views for the COG chart are Lateral View, Front View, Top View, and 3D View.
- Lateral View - The Lateral View tab is selected
by default and shows the lateral view of the Center of Gravity of the
selected Product in the chart area.
- Front View - Shows the front view of the Center
of Gravity of the selected Product in the chart area.
- Top View - Shows the top view of the Center of
Gravity of the selected Product in the chart area.
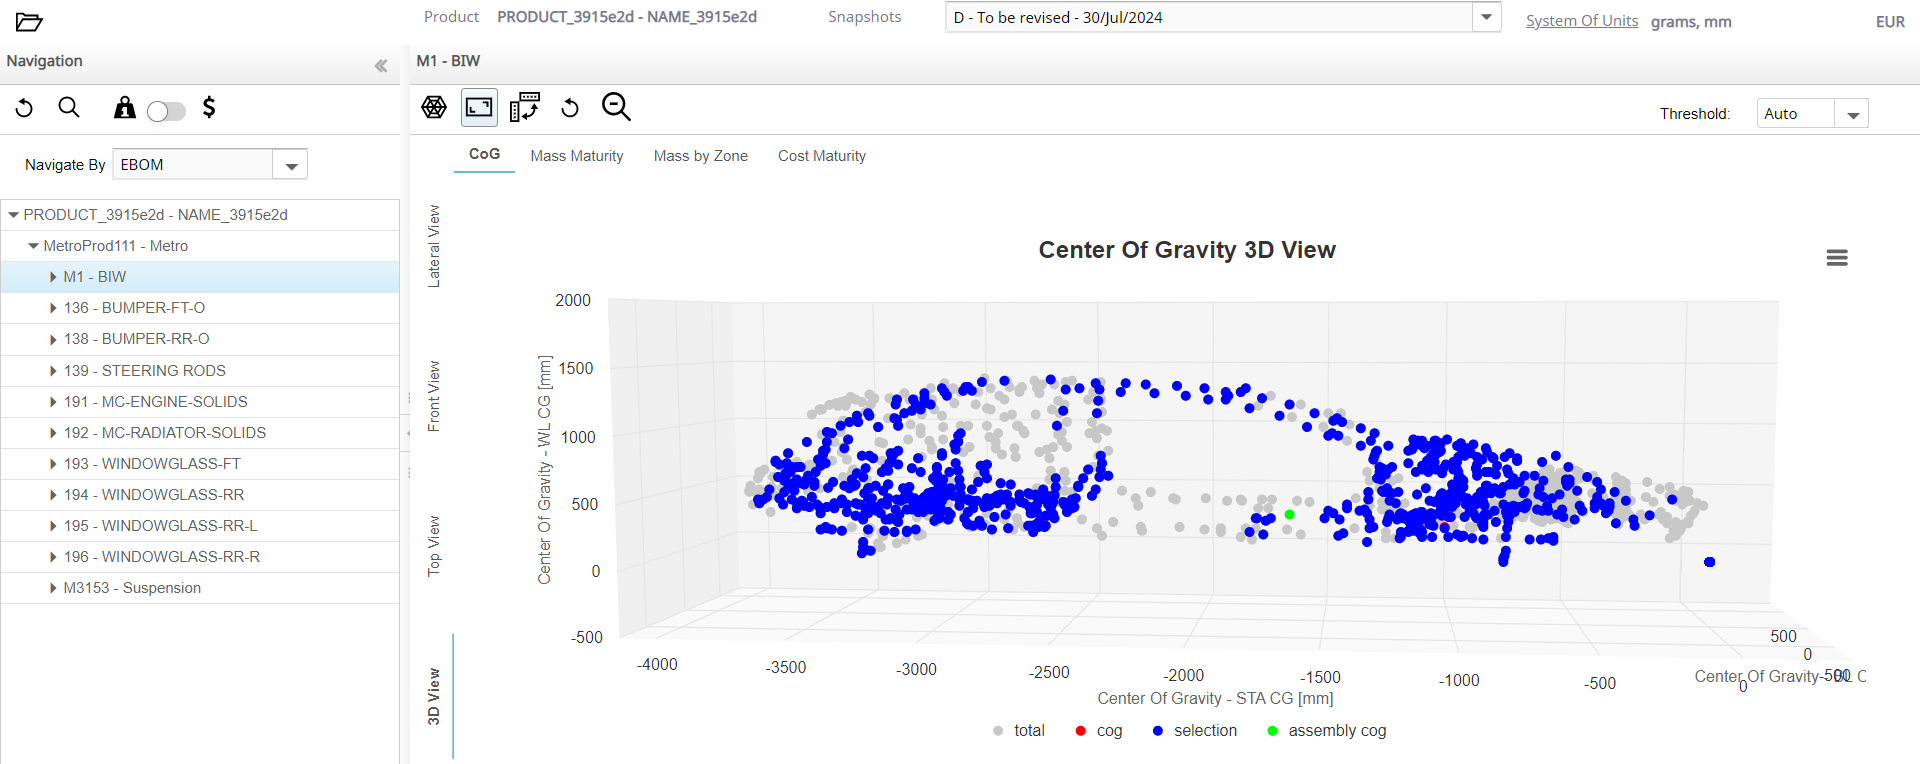
- 3D View - Shows the Snapshot points in three
dimensions and allows you to rotate, zoom, pan, and highlight points
related to the selected assembly in the tree view.
- Lateral View - The Lateral View tab is selected
by default and shows the lateral view of the Center of Gravity of the
selected Product in the chart area.
-
Click the
 icon to reset the zoom.
- Initial View
- Rotated View - Use the mouse wheel to zoom in and out of the
chart. Press the left mouse button and drag to rotate the chart. Hold
the Ctrl key, press the left mouse button, and
drag to pan. Click the icon to reset the zoom while maintaining
the rotation angles.
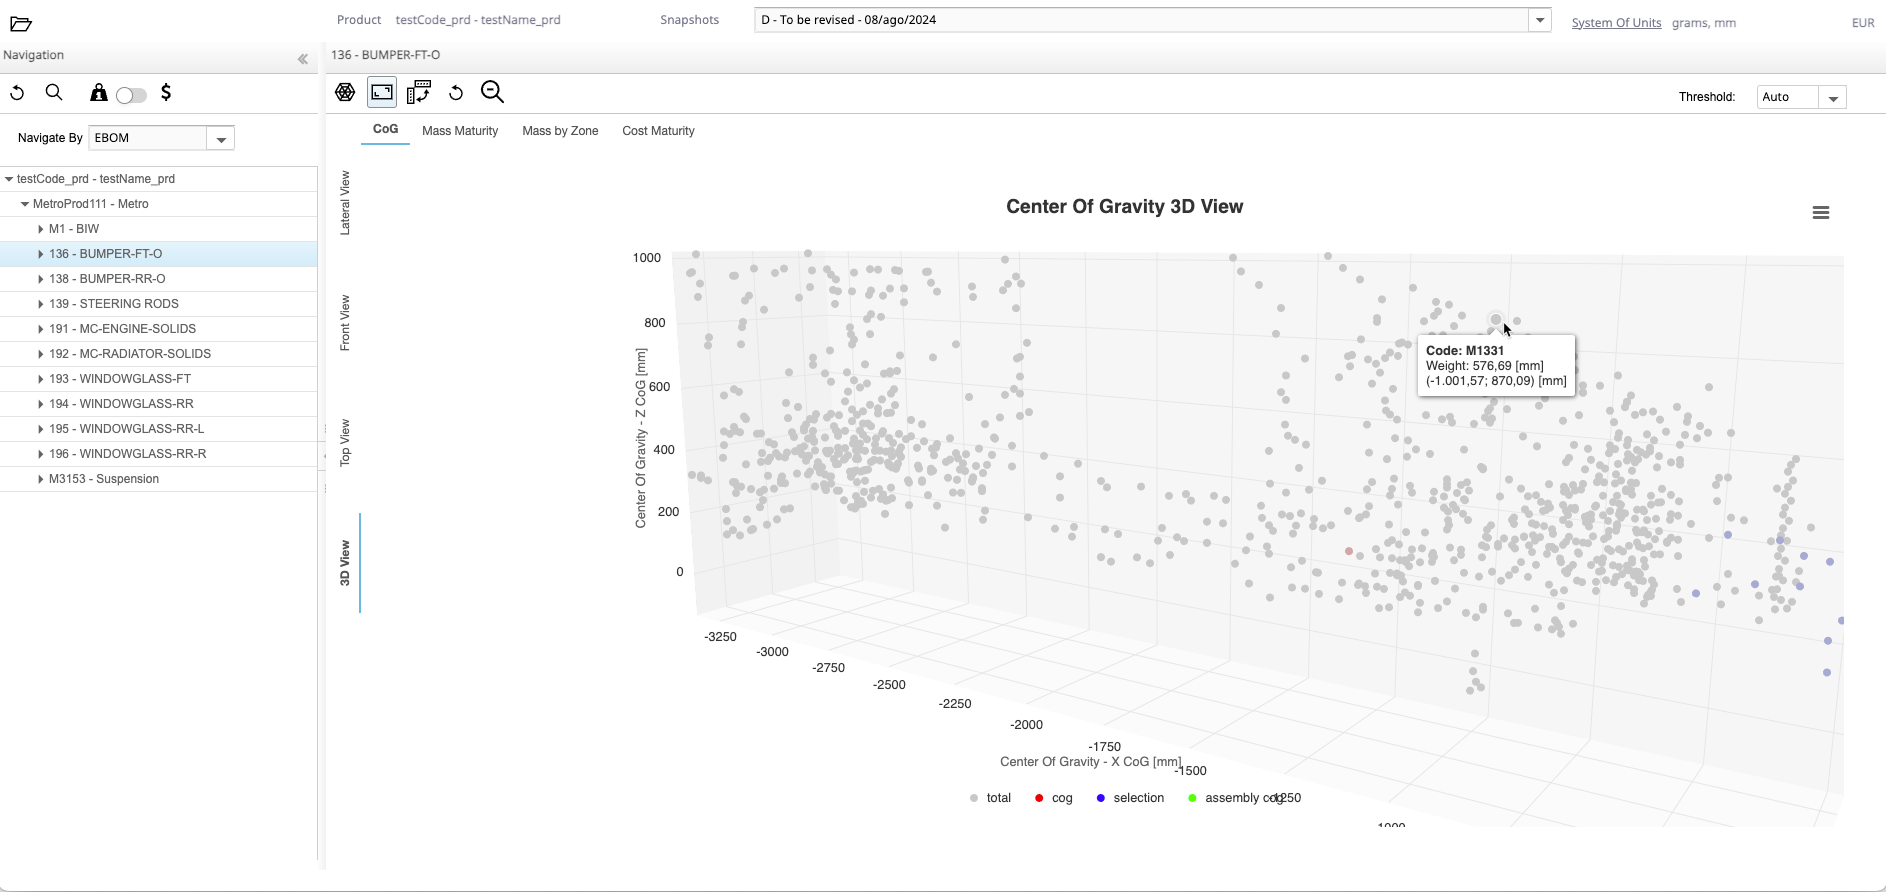
Note: The zoomed in area is displayed. However, in the 2D views such as Lateral, Front, and Top Views, you can click and drag the left mouse button to zoom in. - Rotated and Zoomed View - Click the
 icon to reset the chart to its initial
position.Note: Only in the 3D View, the icon is displayed.
icon to reset the chart to its initial
position.Note: Only in the 3D View, the icon is displayed.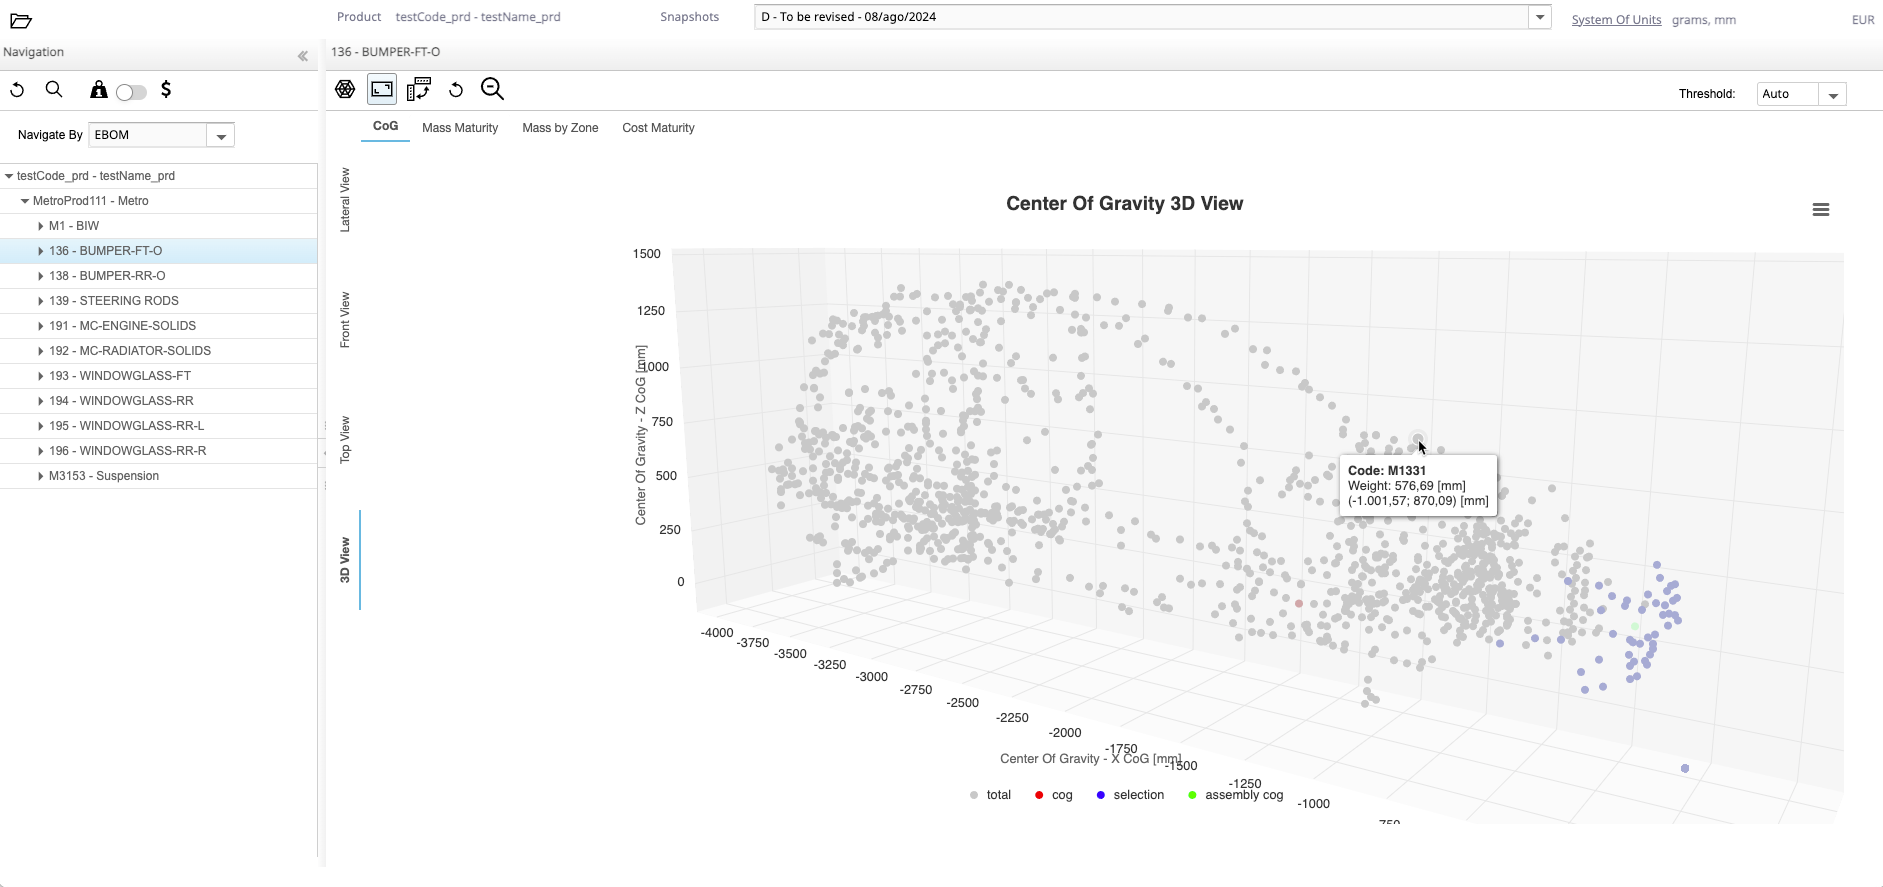
- Initial View
-
Click the
 icon.
All the parts in the Product are displayed irrespective of their participation in the total mass calculation.
icon.
All the parts in the Product are displayed irrespective of their participation in the total mass calculation. -
Again, click the icon.
The parts that are not a participating in the total mass calculation that are visible are now hidden.
-
Click the
 icon.
The chart area is displayed in 1:1 ratio.
icon.
The chart area is displayed in 1:1 ratio. -
Click the
 icon.
The chart fits into the screen.Note: This icon is enabled only when the chart area is displayed in the same scale ratio.
icon.
The chart fits into the screen.Note: This icon is enabled only when the chart area is displayed in the same scale ratio. -
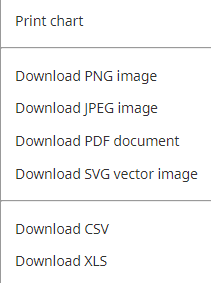
Click the Chart context menu
 icon.
Select a format from the list of available formats to download the chart.
icon.
Select a format from the list of available formats to download the chart.