Mass by Zone Charts
You can see the Lateral, Front, or the Top views of the selected Product in the chart area.
-
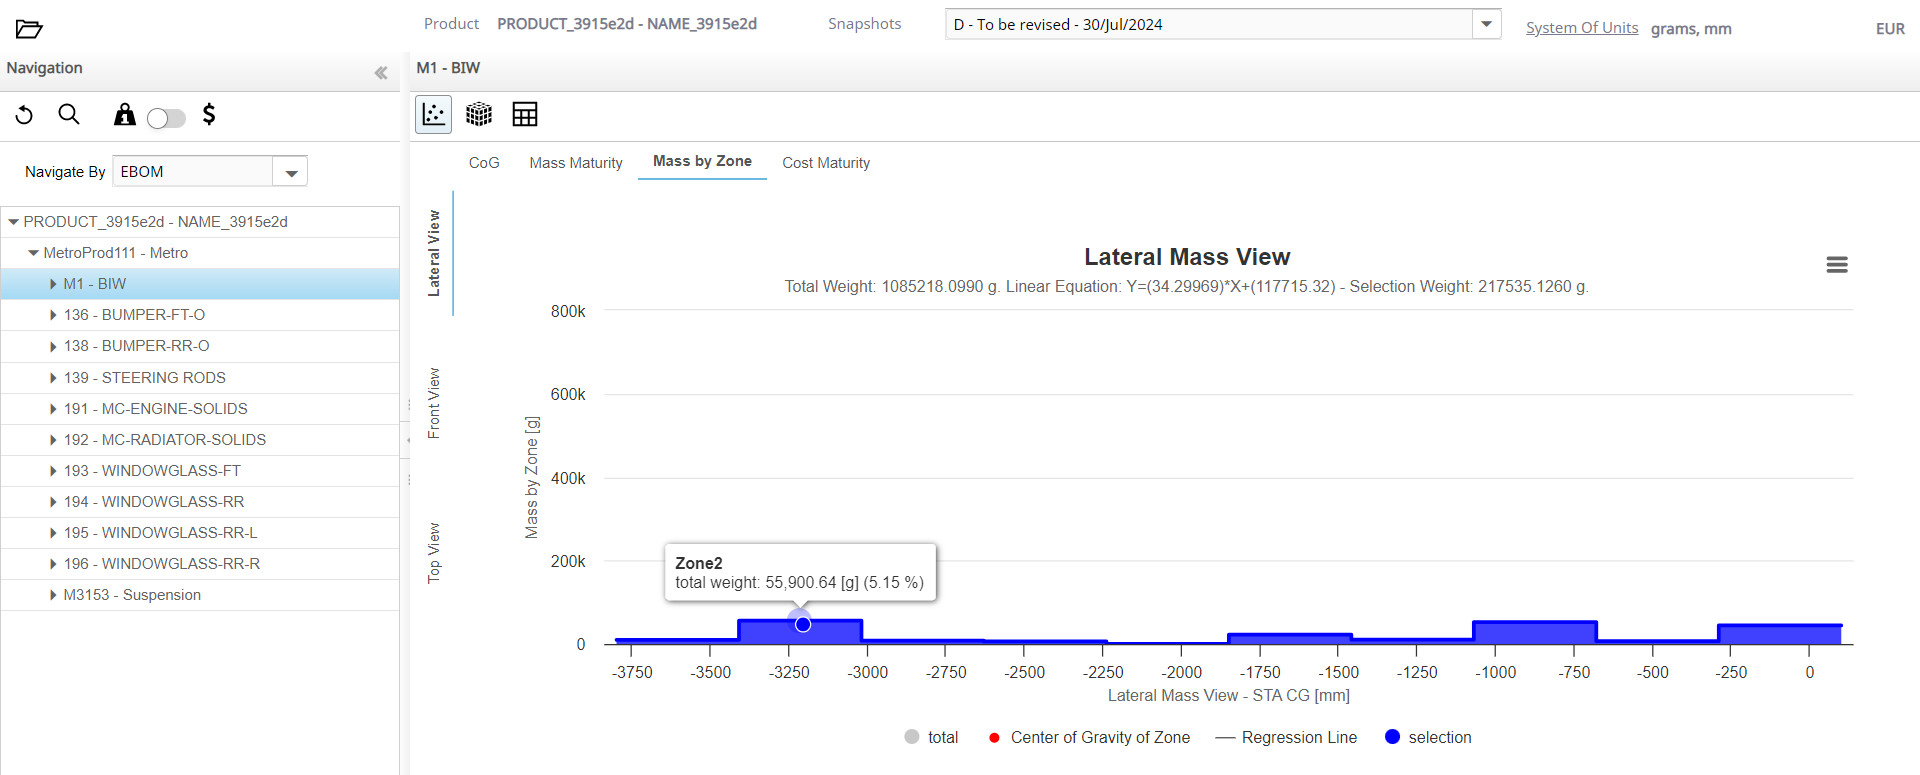
Click Mass by Zone.
The lateral view of the selected Product is displayed in the chart area.
-
Click the
 icon to show or hide regression lines.
The regression lines are displayed in the chart and the formula is shown in the subtitle.
icon to show or hide regression lines.
The regression lines are displayed in the chart and the formula is shown in the subtitle.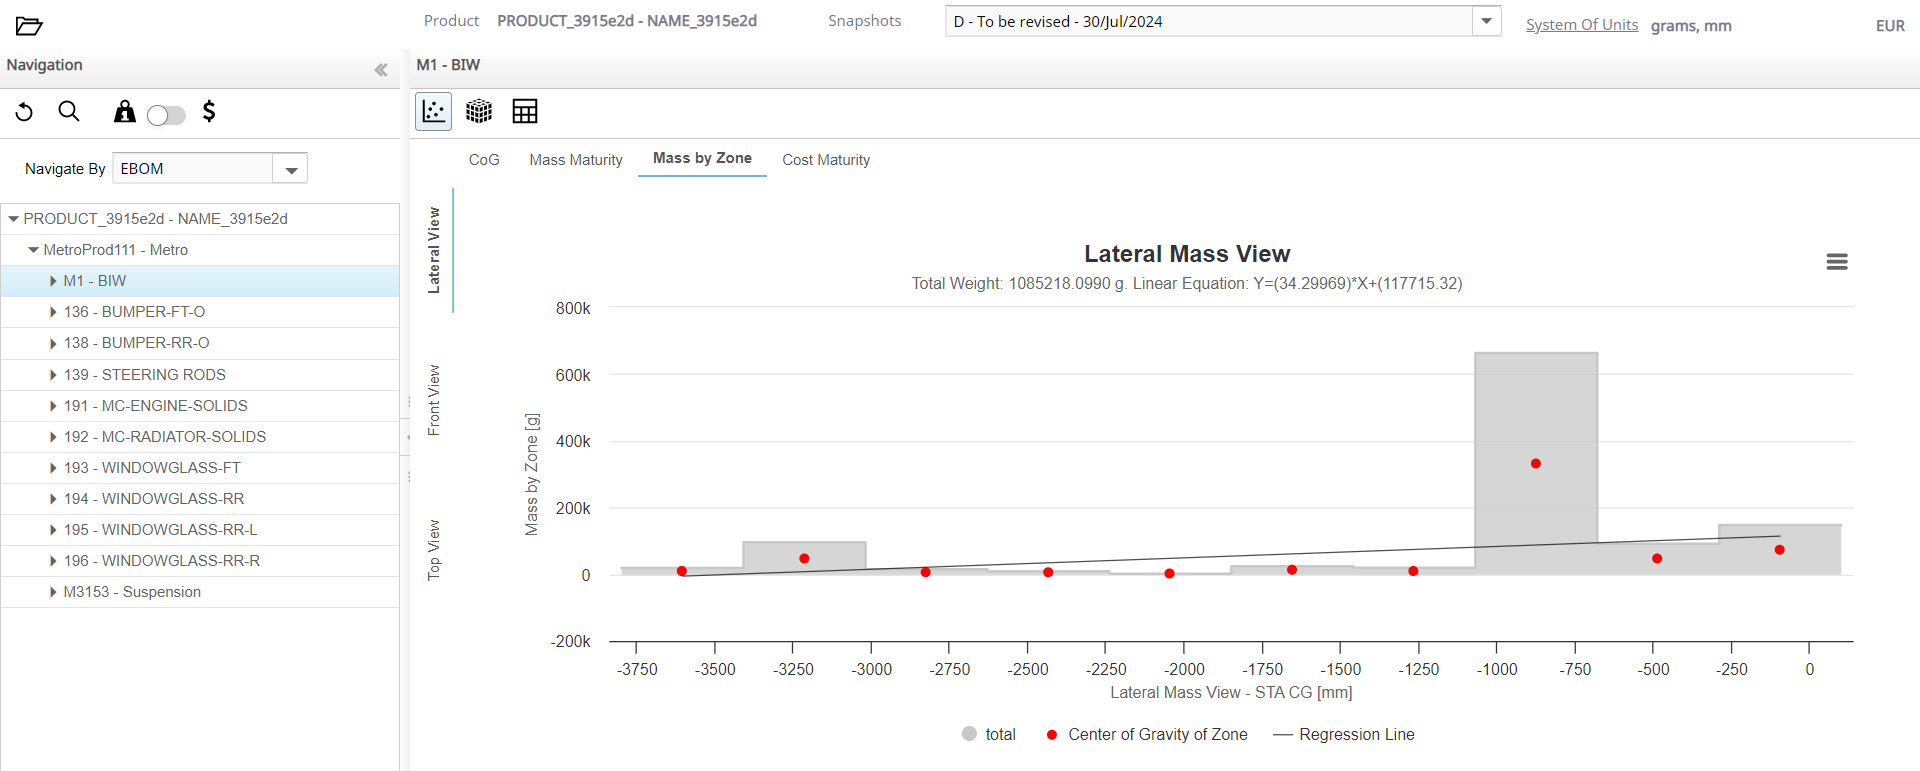 The line showing the mass distribution (balance) in
different defined zones is displayed in the chart.
The line showing the mass distribution (balance) in
different defined zones is displayed in the chart.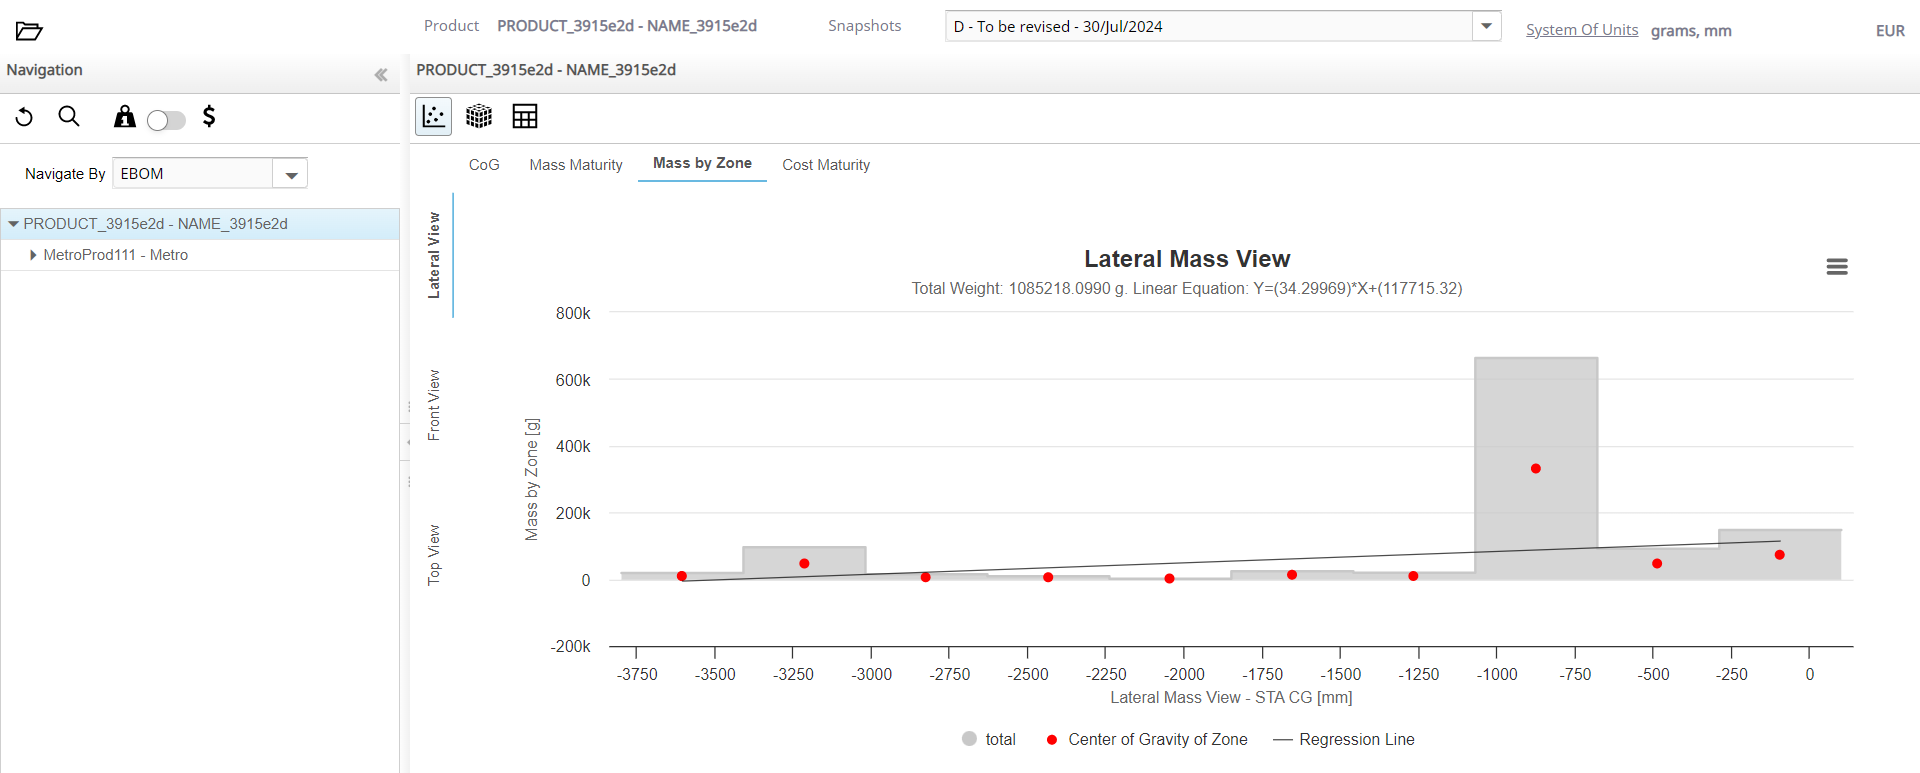
-
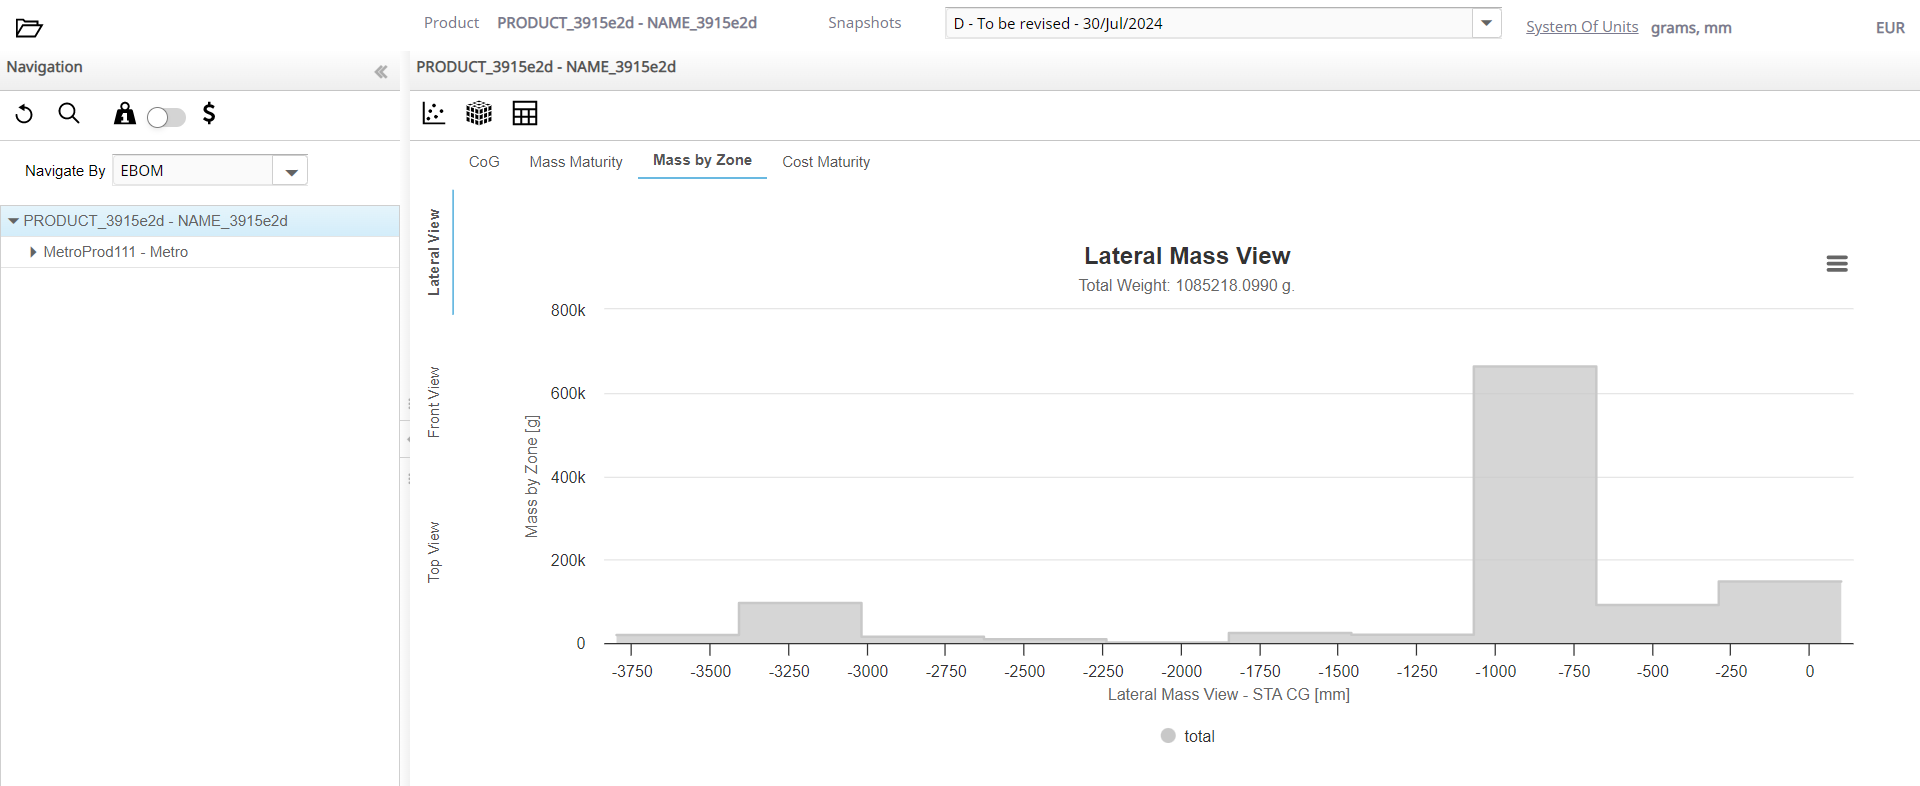
Select any part in the Navigation panel.
The part is highlighted in blue in the chart area.
 Note: The total weight, the line equation (if the Plot Regression Line is active), and the selected part weight of the Product are displayed at the top of the chart area.
-
Place the mouse on a specific zone in the chart.
The zone number, total weight, and their coordination points are displayed.
-
Click and drag the left mouse button to zoom in on an area in the chart.
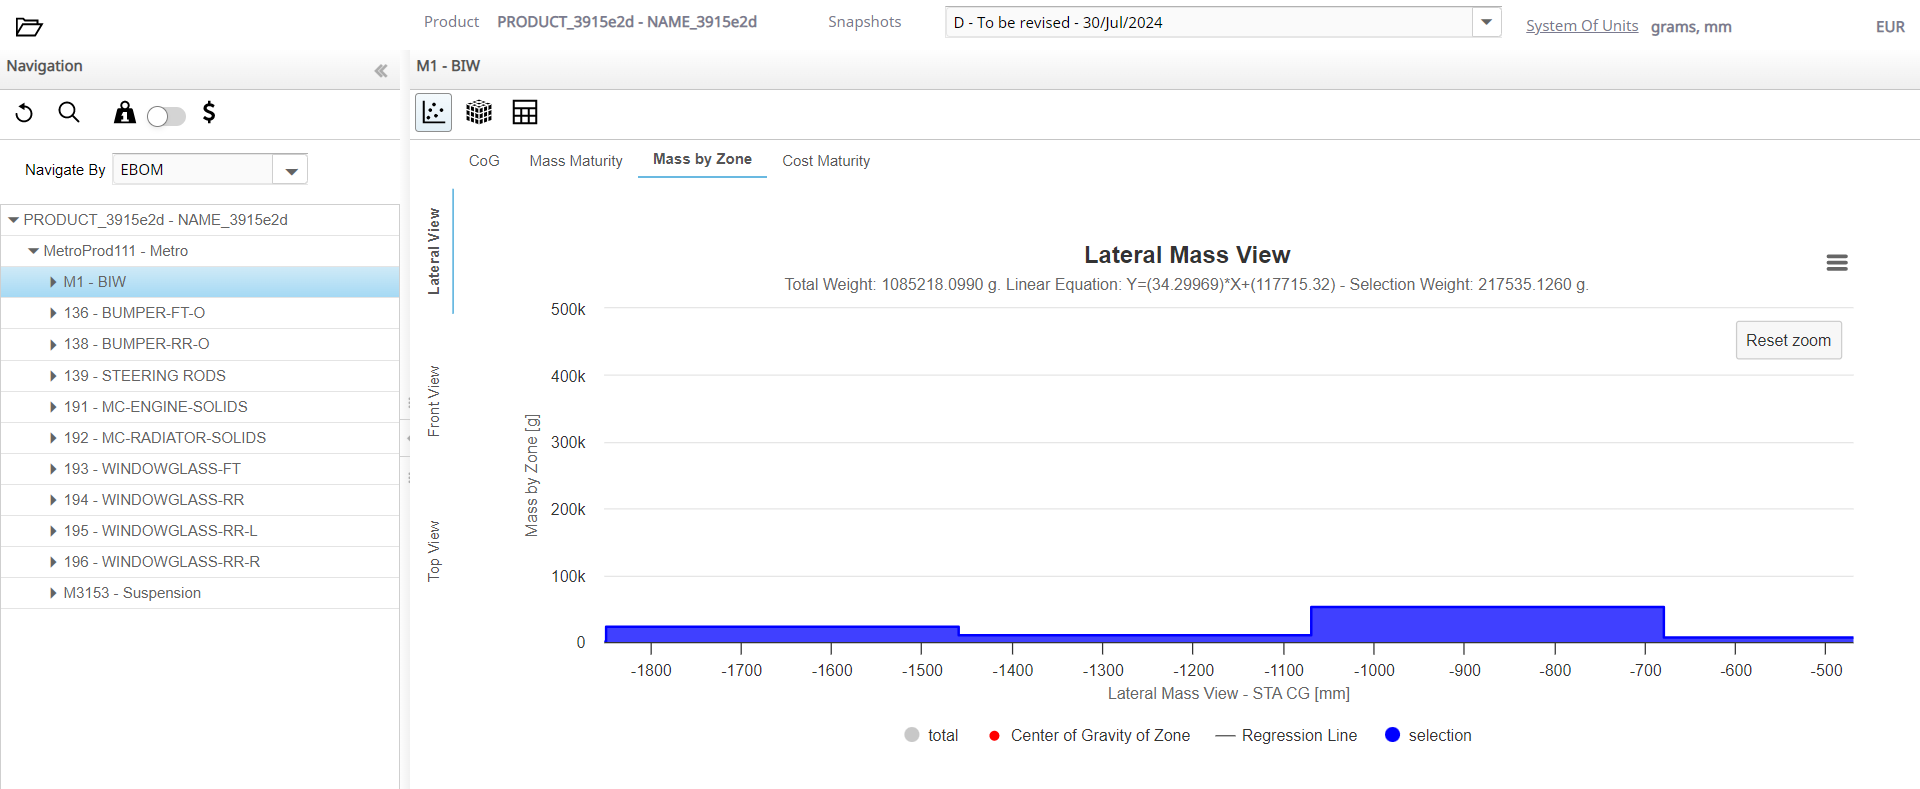 The zoomed in area is displayed.
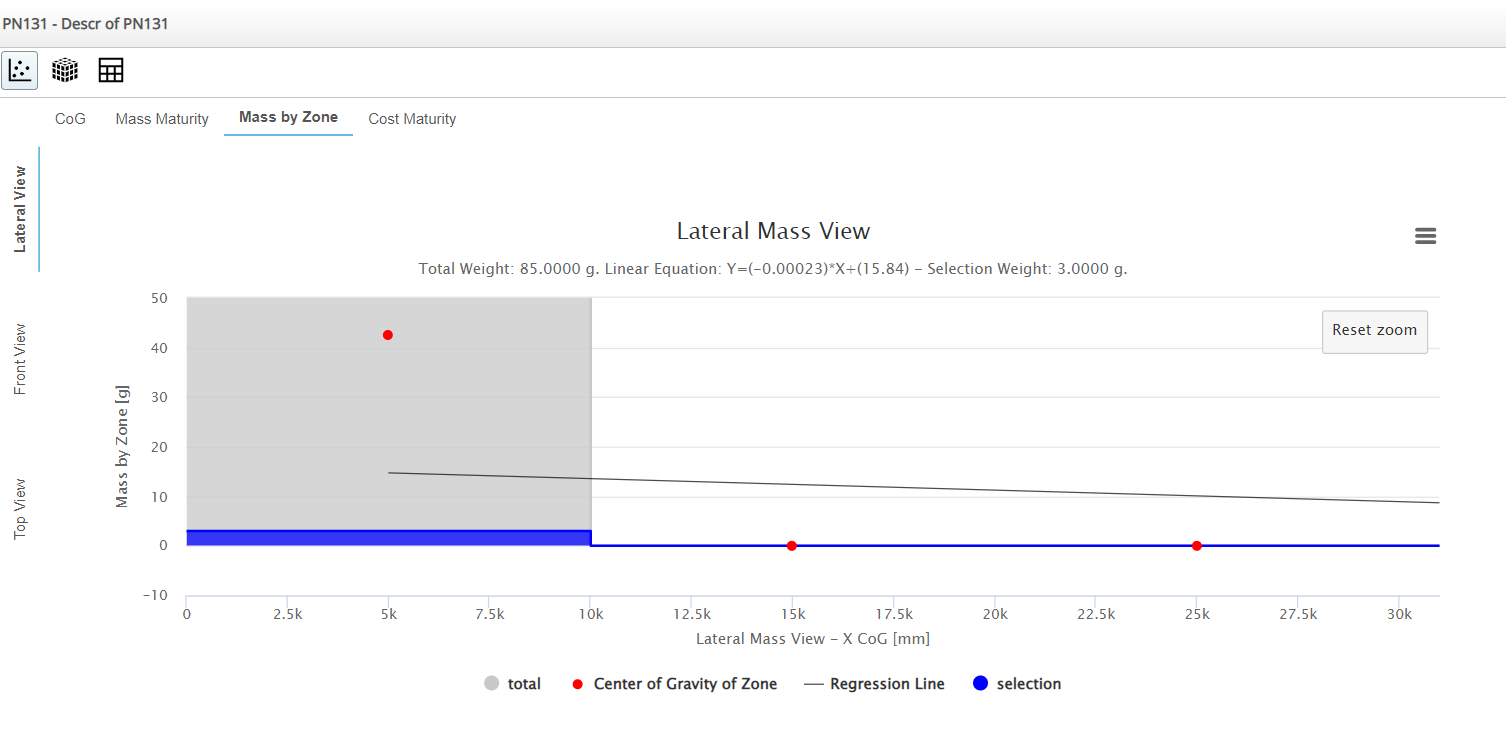
-
Next, click the
icon to show or hide regression lines.
The line showing different defined zones is removed from the chart.
-
In the chart area, click the
 icon.
The Mass Distribution Table is displayed.
icon.
The Mass Distribution Table is displayed. Note: The Mass Distribution Table displays a breakdown of all the parts that contribute to the weight of each zone, with each zone row highlighted in blue. By default, WA displays the ten parts of each zone with the most relevant weight. The following options are available:
- Click the
 icon to clear all the filters and
display the parts of all zones.
icon to clear all the filters and
display the parts of all zones.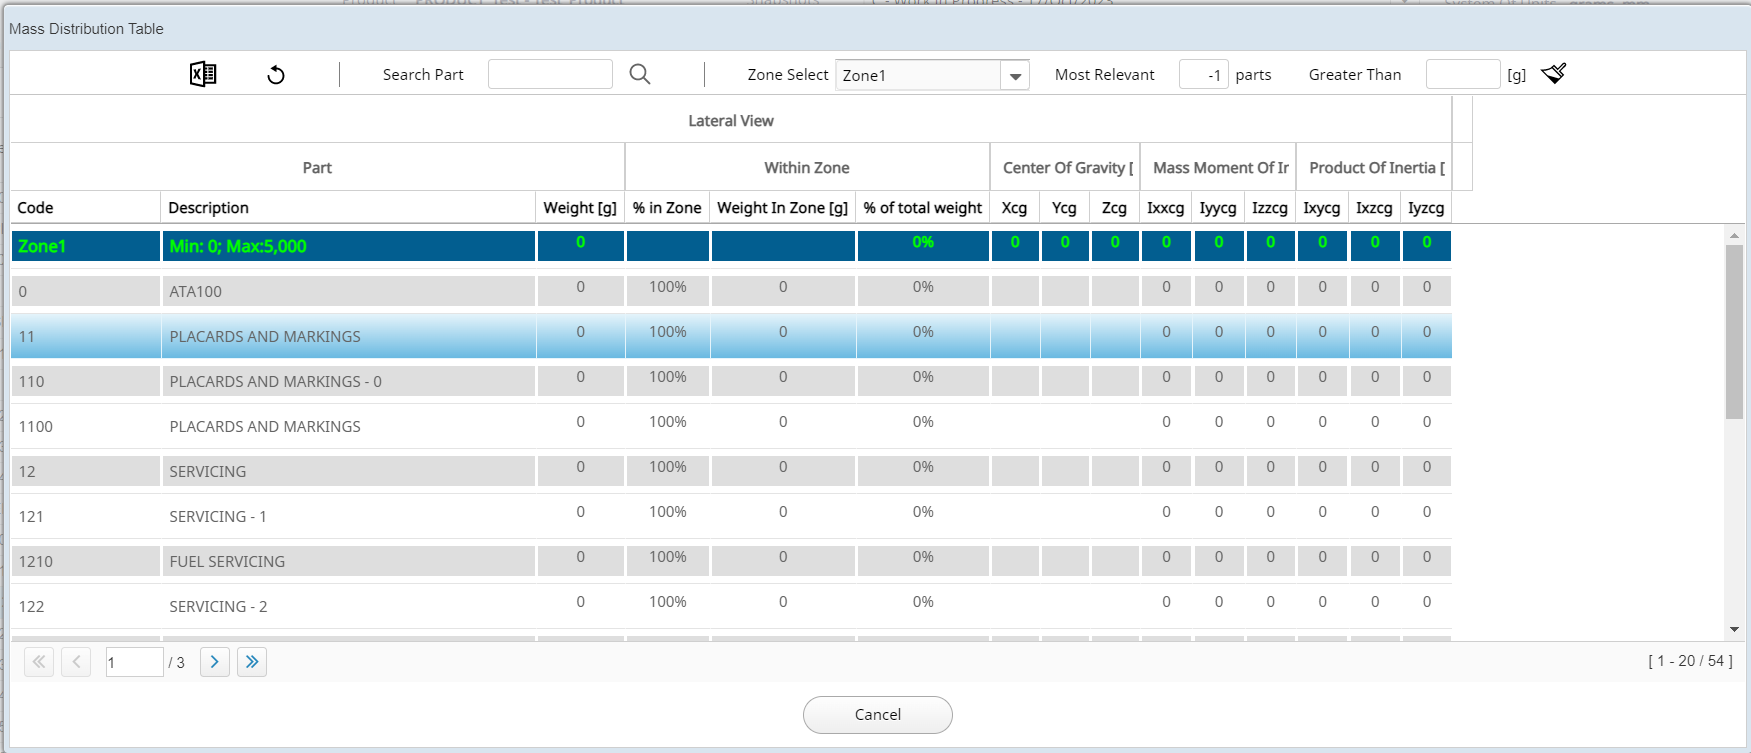
- Click the
 icon to remove all the existing filters
(including the zones) and then filter on the basis of the PN added.
If the part is not found, WA displays
only the zone rows in the table.
icon to remove all the existing filters
(including the zones) and then filter on the basis of the PN added.
If the part is not found, WA displays
only the zone rows in the table. - Select a zone from the Zone Select dropdown
list. to view only the parts of a specific zone. The results
obtained by one of the above filters are narrowed (if it was done
using the Most Relevant or Greater
Than filters) to a single selected zone.
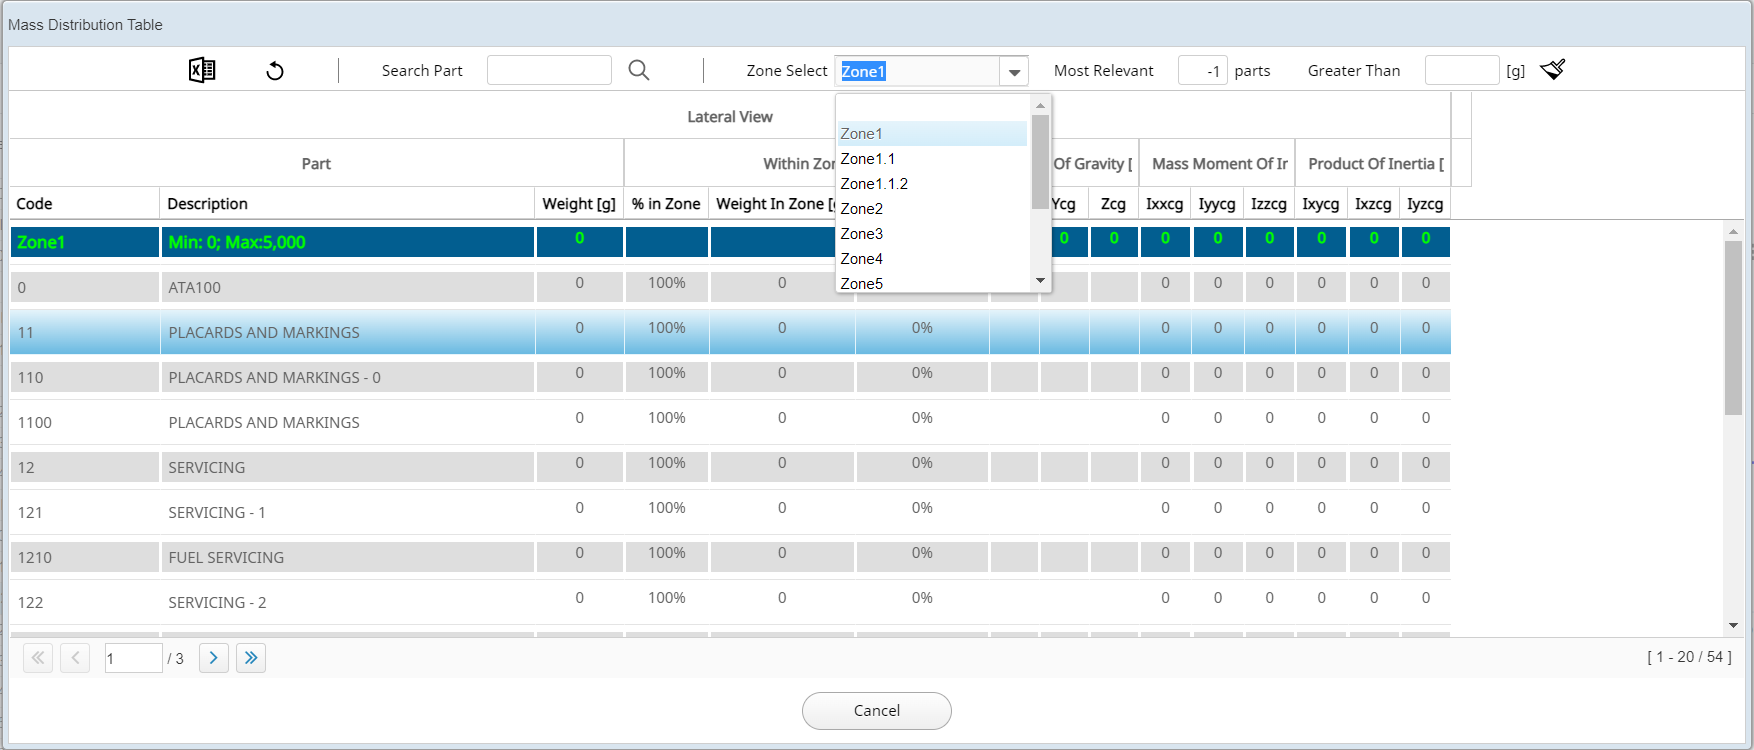
- Select a value from the Most Relevant dropdown list to define the number of relevant parts that you want displayed for each zone by entering the required number in the text field. This option filters the heaviest part for each zone.
- Select a value from the Greater Than dropdown list to search for all parts inside all the zones that have a weight greater than the specified value.
- Click the Clear Filters
 icon to clear all the filters and
display the initial defined data.
icon to clear all the filters and
display the initial defined data. - Click the Report
 icon to export the entire table
displayed with the applied filters.
icon to export the entire table
displayed with the applied filters.
- Click the
-
In the chart area, click the
 icon to define the zones for each view.
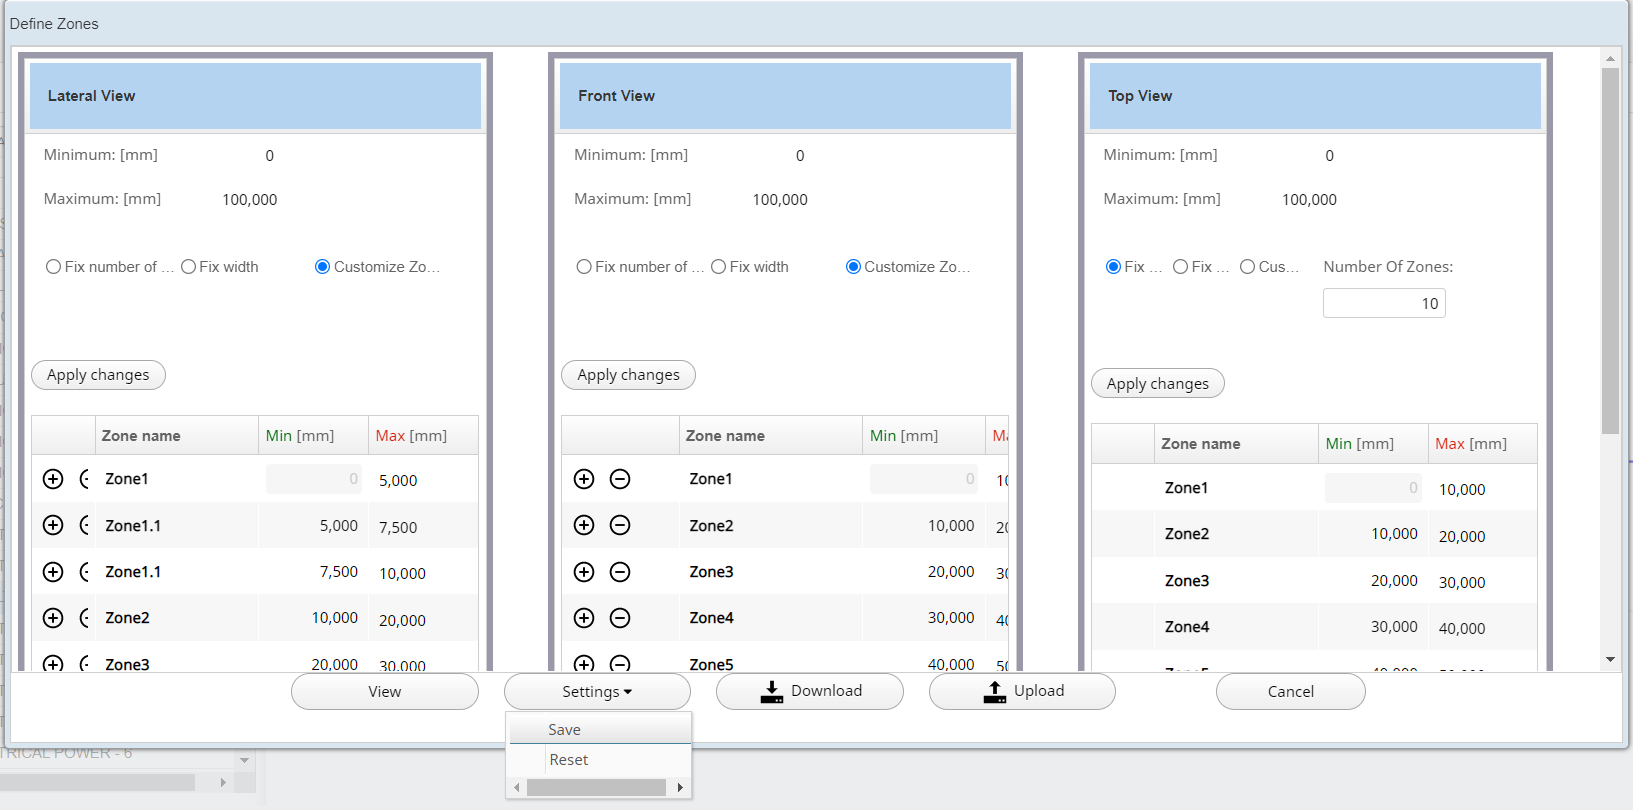
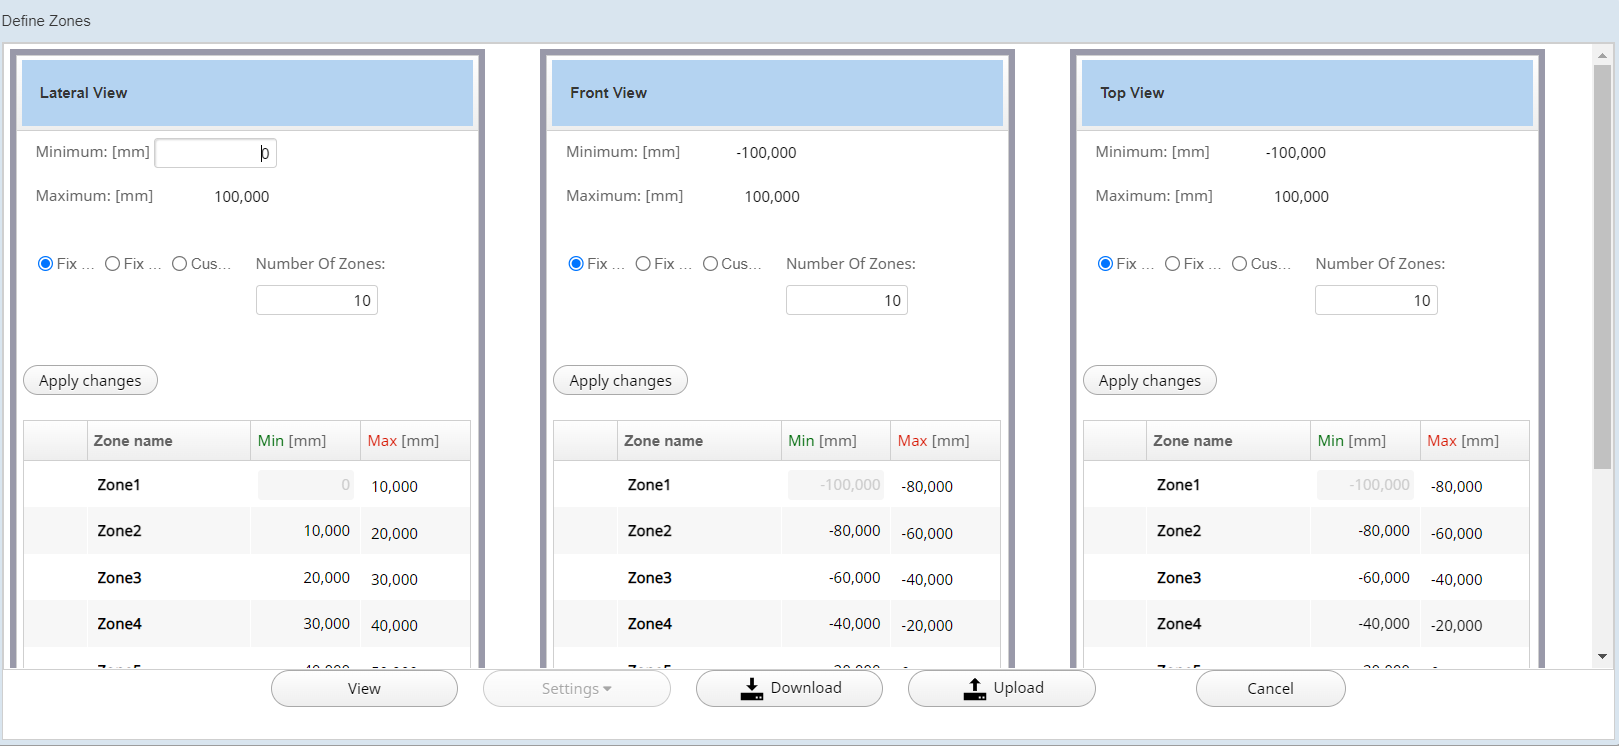 Note: By default, WA displays views with ten fixed zones. You can customize a different zone for each view.
- Fix number of zones: Enter the required number of zones for the chart and click Apply changes.
- Fix width: Enter the required width in the text field labeled Fix width and click Apply changes.
- Customize Zones:
Define each area by entering the data directly into the table.
- Specify a new name for any zone by double-clicking the Zone name . Similarly, by
double-clicking the End value, you can specify a new end value for each
zone or use the arrows.
 Note: The end value must not be null.
- Click the
 icon to create a new zone
with the start value as the end of the starting
zone.
icon to create a new zone
with the start value as the end of the starting
zone. - Click the
 icon to delete the selected
zone.
icon to delete the selected
zone.
- Click the
-
Click
 to download the zone settings as a .json
file.
to download the zone settings as a .json
file.
-
Click
 to upload a .json file to define the
zones.
to upload a .json file to define the
zones.
-
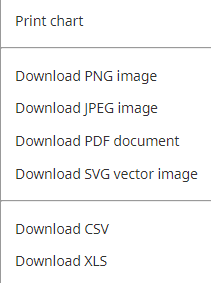
Click the Chart context menu
 icon to select the required format to download
the chart.
icon to select the required format to download
the chart.