Weight & Balance Engineering, also known as Mass Properties Engineering, is the technical discipline which refers
to the prediction, determination, management and tracking of the weight, Center of Gravity, and Moment of Inertia
for a new product.
The Programs > Management page allows you to create and manage programs in the database. A Program structure includes Versions, Variants, and Products
in the order of hierarchy.
WA provides a powerful and comprehensive mission simulation module which allows you to calculate the evolution of the weight
during the flight and to monitor how this curve changes over the product life cycle.
WA allows you to query the related data in a report. Any product created has a Concept or a Snapshot available in Work in Progress or in the Approved status.
WA enables faster and more accurate decision-making with on-demand access to a protocol of standard and regular charts targeted
for different recipients:
You can view the CoG chart in the Center of Gravity, Lateral View, Front View, Top View, and 3D View for the selected
Part or Product in the chart area.
WA shows you the Cost and Weight trends vs Snapshots available in the current product. This analysis allows you to compare
metric values with Snapshot evolution.
WA enables faster and more accurate decision-making with on-demand access to a protocol of standard and regular charts targeted
for different recipients:
You can review the charts in various views in the chart area with respect to a
selected Product.
To review a chart:
Click Analytics > Charts.
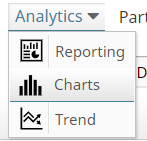
The Charts page is displayed.
Click the Select Product icon.
Select a Product that has a Snapshot and click Select Product.
The product name is populated against the Product label and the latest uploaded Snapshot is
selected by default.
Note: You can select the required Snapshot from the Snapshots dropdown list.
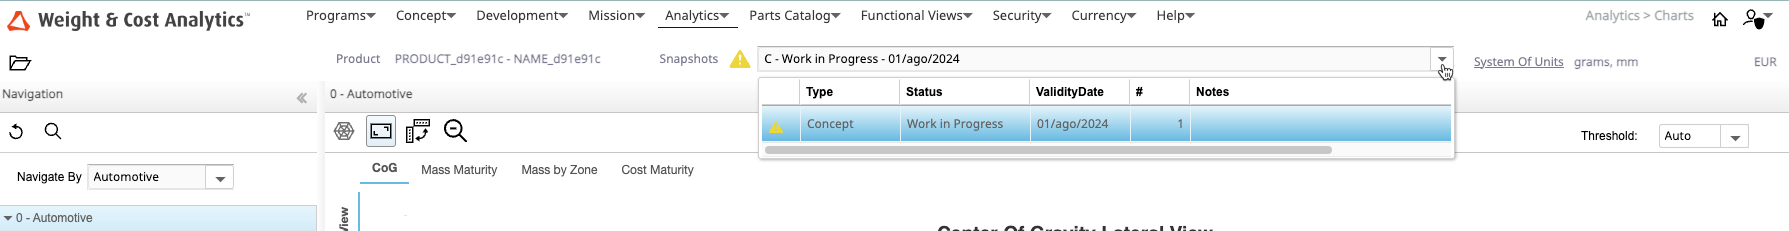
The selected Product's parts is displayed in the navigation panel.
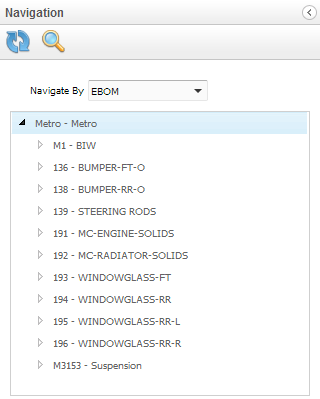
Select EBOM from the Navigate By dropdown list.
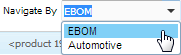
Note: You can select the required Functional Views or EBOM (real physical structure).
CoG Chart
You can view the CoG chart in the Center of Gravity, Lateral View, Front View, Top View, and 3D View for the selected Part or Product in the chart area.
Mass Maturity Charts
You can view the detailed and grouped view of a selected Product in a Pie chart in the chart area.
Mass by Zone Charts
You can see the Lateral, Front, or the Top views of the selected Product in the chart area.
Cost Maturity Charts
You can view the detailed and grouped view of a selected Product in a Pie chart in the chart area.