WA shows you the Cost and Weight trends vs Snapshots
available in the current product. This analysis allows you to compare metric values with
Snapshot evolution.
To perform trend analysis:
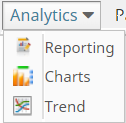
Click Analytics > Trend.
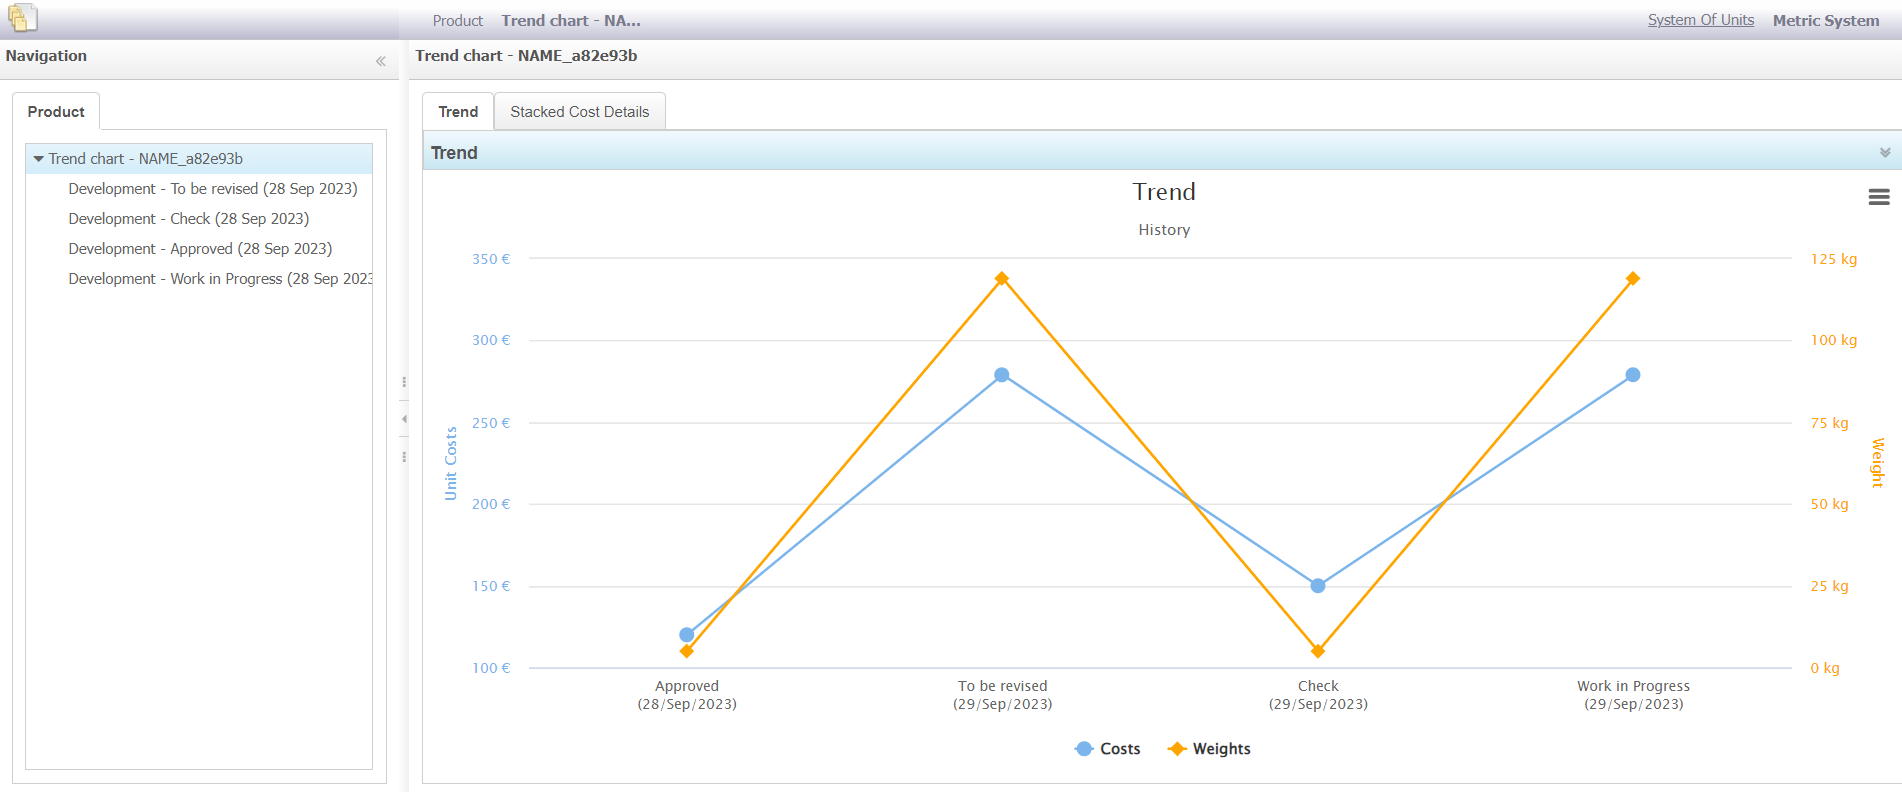
The Worksheet View page displays two tabs - Trend
and Stacked Cost Details.
In the right panel, select the Trend tab.
The chart shows Cost and Weight vs Snapshots available for the current
product (as listed in the tree view in the left panel).
Note: The Snapshot date values shown in the tree (left
panel) refer to the Creation Date (or Approval/Frozen Date if the
Snapshot has been approved), whereas the Snapshot date values shown on
the X-axis in the chart refer to the Current Date (or Approval Date if
the Snapshot has been approved).
Use the legend to enable/disable
the cost and weight for a Snapshot, and view the respective trends for
each.
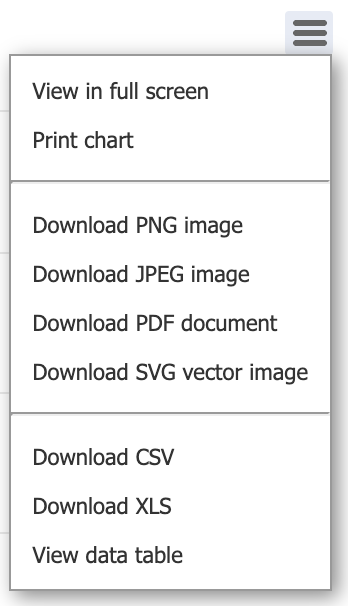
Click the icon to export the chart in various formats
such as PNG, JPEG, PDF, SVG vector image, CSV, XLS, and so on.
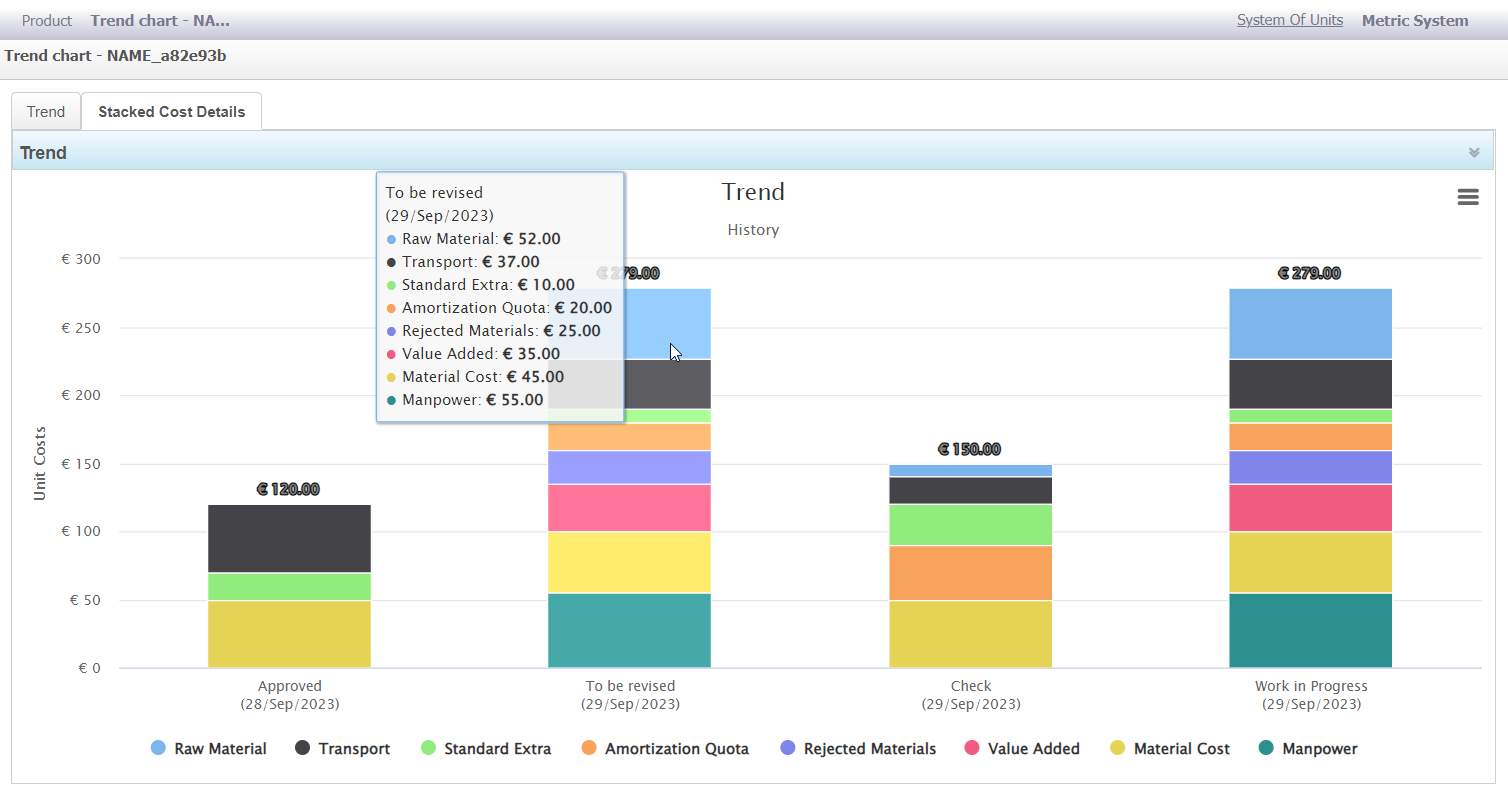
Stacked Cost Details
To view the stacked cost details for the available
Snapshots:
In the right panel, select the Stacked Cost Details
tab.
All the Snapshots listed in the tree view display details of the various
cost attributes in the form of a Stacked chart.
Note: The Snapshot date values shown in the tree (left
panel) refer to the Creation Date (or Approval/Frozen Date if the
Snapshot has been approved), whereas the Snapshot date values shown on
the X-axis in the chart refer to the Current Date (or Approval Date if
the Snapshot has been approved).
 The chart shows Cost and Weight vs Snapshots available for the current product (as listed in the tree view in the left panel).Note: The Snapshot date values shown in the tree (left panel) refer to the Creation Date (or Approval/Frozen Date if the Snapshot has been approved), whereas the Snapshot date values shown on the X-axis in the chart refer to the Current Date (or Approval Date if the Snapshot has been approved).Use the legend to enable/disable the cost and weight for a Snapshot, and view the respective trends for each.Click the
 icon to export the chart in various formats
such as PNG, JPEG, PDF, SVG vector image, CSV, XLS, and so on.
icon to export the chart in various formats
such as PNG, JPEG, PDF, SVG vector image, CSV, XLS, and so on.