Charts
WA enables faster and more accurate decision-making with on-demand access to a protocol of standard and regular charts targeted for different recipients:
The following types of charts are available:
- CoG
- Mass Maturity
- Mass by Zone
- Cost Maturity
Using the standard reporting functionalities provided by WA,
you can:
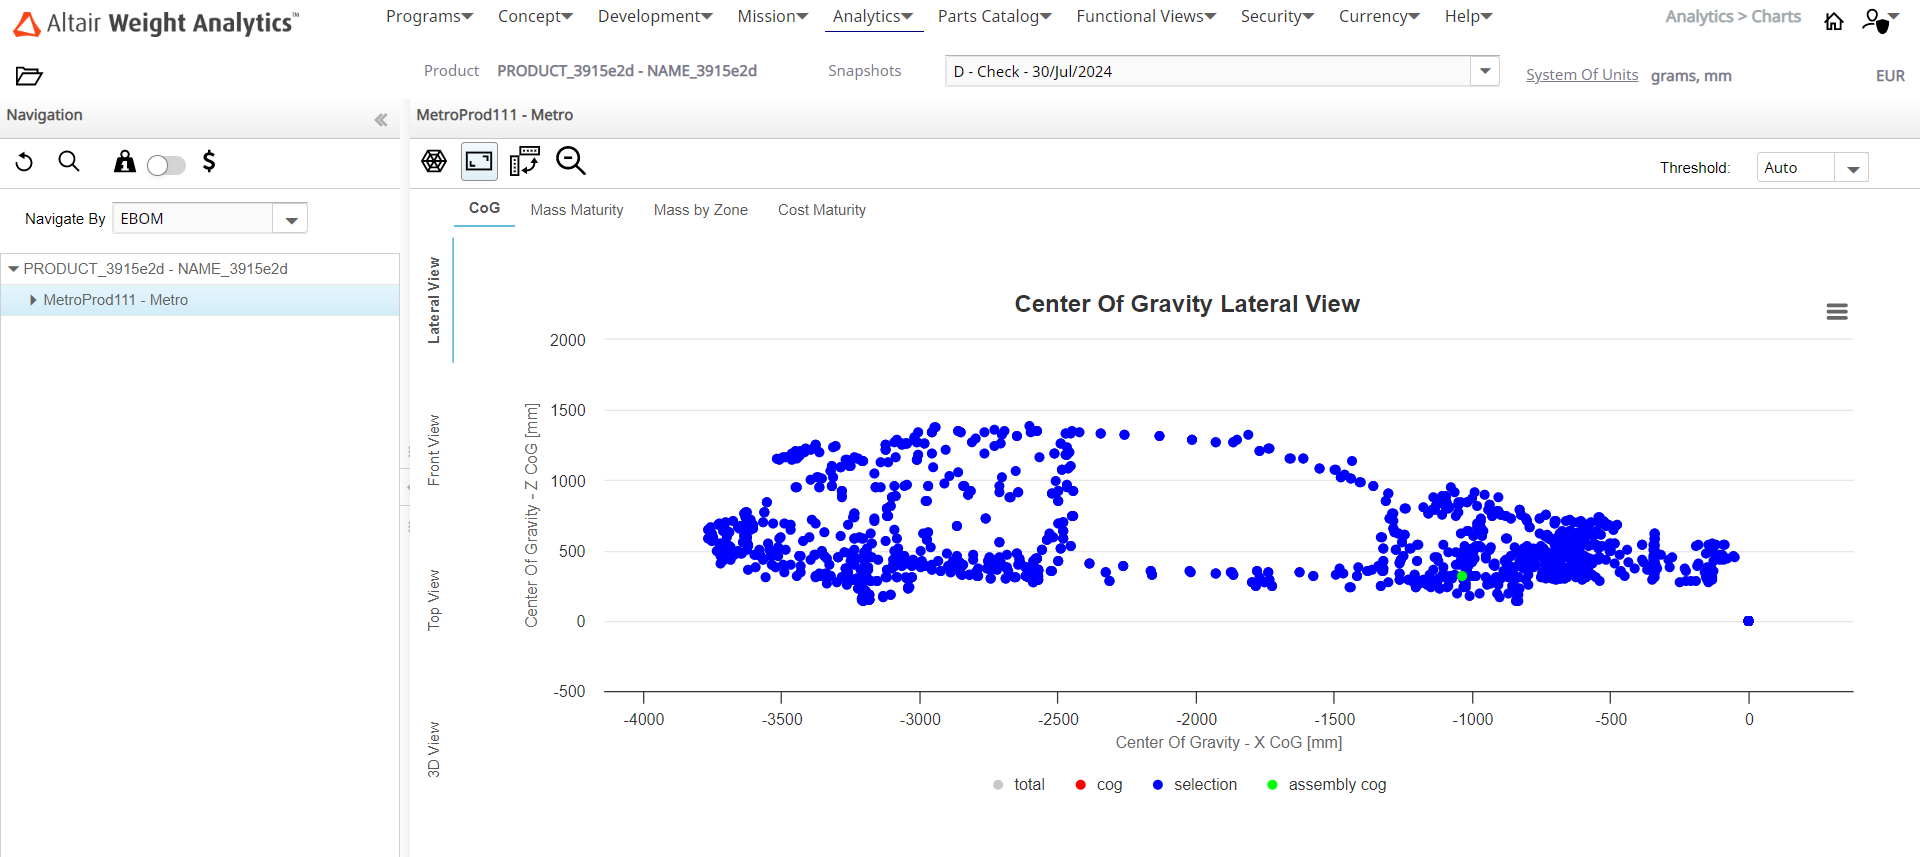
- Use the CoG chart to:
- Identify the exact location of each system and subsystem of your company’s functional breakdown.
- Highlight wrongly positioned items outside the product area.
- Highlight zero-count CoG parts which come from designers’ PLM tools.
- Highlight which parts/assemblies don’t contribute to MoI calculations. For example, symmetrical parts wrongly positioned on the axis.
- Use the Mass Maturity chart to:
- Visualize the maturity distribution of the selected parts or a complete BoM.
- Monitor how the product/assembly maturity evolves over time.
- Use the Mass by Zone chart to:
- Display the mass distribution along x,y and z axis.
- Identify systems and subsystems which contribute more in each zone.
- Use the Cost Maturity chart to:
-
- Visualize the cost distribution of the selected parts or a complete BoM.
- Monitor how the product/assembly maturity evolves over time.
Note:
- You can view the Charts section only when you have created a product with at least one Concept or Snapshot in the Work in Progress or in the Approved status.
- The Charts page is displayed based on the Functional views selected for a specific Product under the Main Attributes tab of the Program.
Note: The Charts page is empty if you have not
selected a Product. If you are working on a Product, that Product is selected by default in
the Charts page and is maintained throughout
different sessions.
The Charts page allows you to:
- View the Center of Gravity, Lateral View, Front View, Top View, and 3D View of the selected Part or Product.
- View the Detailed and Grouped views.
- View the mass of the selected part or Product in Lateral view, Front view, and Top view.
- Reload the Product tree in the navigation bar
- Search for a part in the selected Product.