Test area
Home page view
The description below is mainly based on one example dealing with synchronous machine with permanent magnets and inner rotor. However, the main principles are common for every kind of machine.
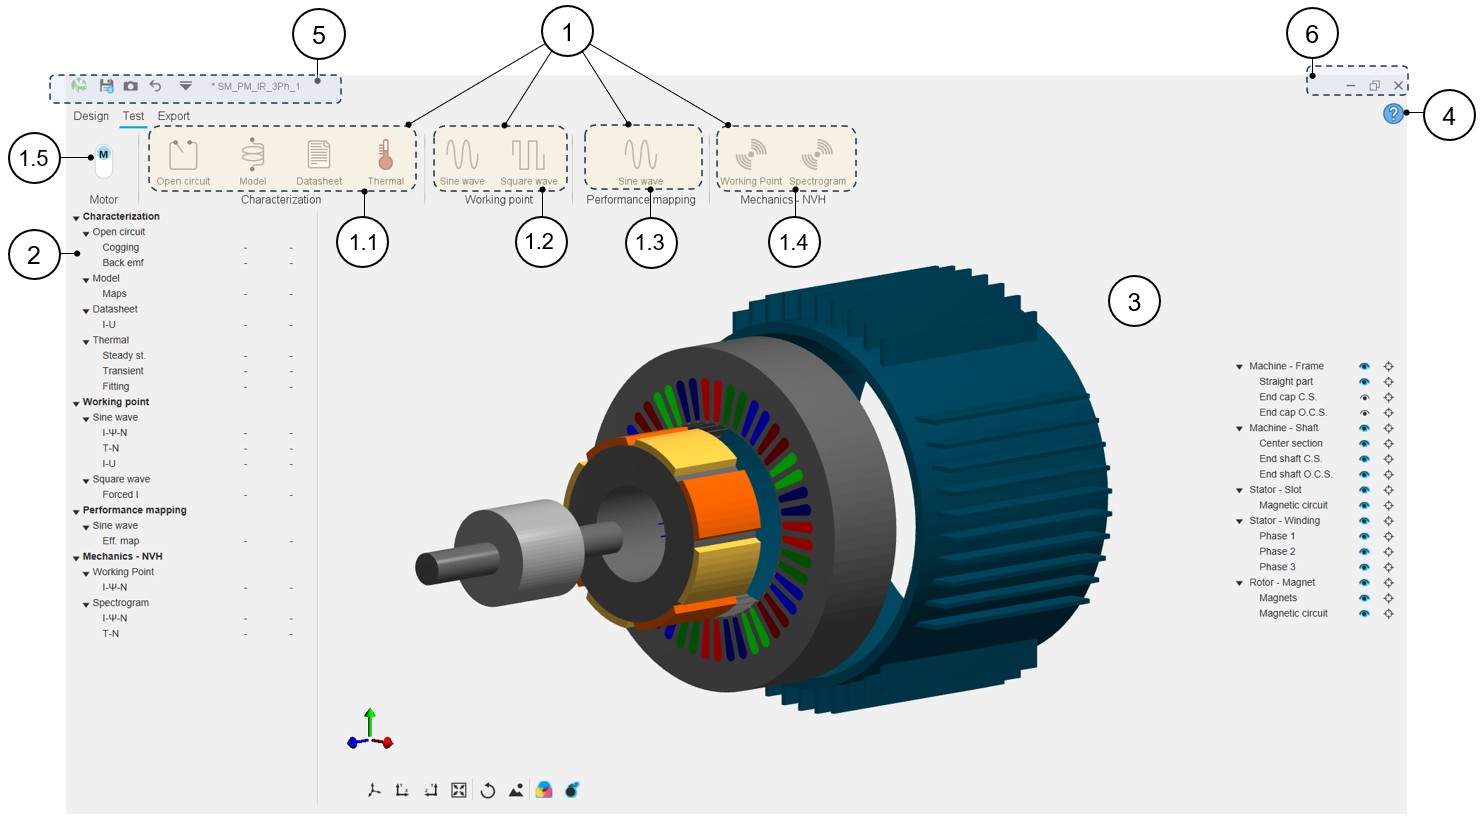
In the Motor Factory Test environment, standard tests are ready to be performed. The GUI allows fulfilling all the steps needed to perform the test with customized settings. An overview of the Motor Factory – Test area is presented in the picture below.
 |
|
|---|---|
| 1 | Visualization and access to the different test packages
classified into test families. In this example 4 families of test
families are available:
Then one click on a package’s icon opens it and gives access to the list of tests stored in it. |
| 1.1 | Characterization tests with packages of tests for characterizing the machine: equivalent scheme parameters, maps,... |
| 1.2 | Working point tests with packages of tests for computing machine performance at working points are presented. |
| 1.3 | Performance mapping tests with packages of tests for computing efficiency maps, duty cycle etc. |
| 1.4 | Mechanics – NVH tests with a package of tests to get an NVH evaluation in early design stage |
| 1.5 | Selection of the operating mode and/or associated convention of the machine. |
| 2 | Selection tree of tests where shortcuts allow access to the test
report datasheet. All the test names are displayed in this zone and
classified under test families and test packages. Note: The tests available are filtered according
to the selection of the operating mode, Motor or
Generator. |
| 3 | Motor Factory – Test home page. A 3D view illustrates the considered machine. |
| 4 | Access to the online user help guide dedicated to the usage of
the Motor Factory – Test area. Note: Each type
of machine has its own dedicated online user help
guide. |
| 5-6 | Access to general functions and tools for managing the project and the GUI. Refer to the section dedicated to the System functions. |
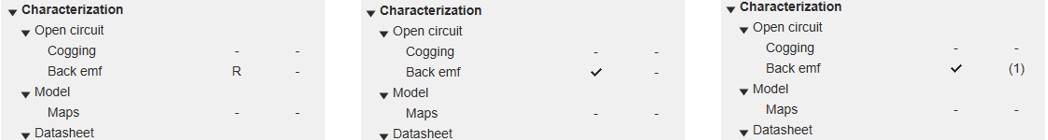
When no test package is selected, an overview (“TEST OVERVIEW”) appears, giving more details about the status of each test.
Here is an illustration for Synchronous Machine with Permanent Magnets.
Clicking on a test row shows the operational area dedicated to the corresponding test.
Test pages
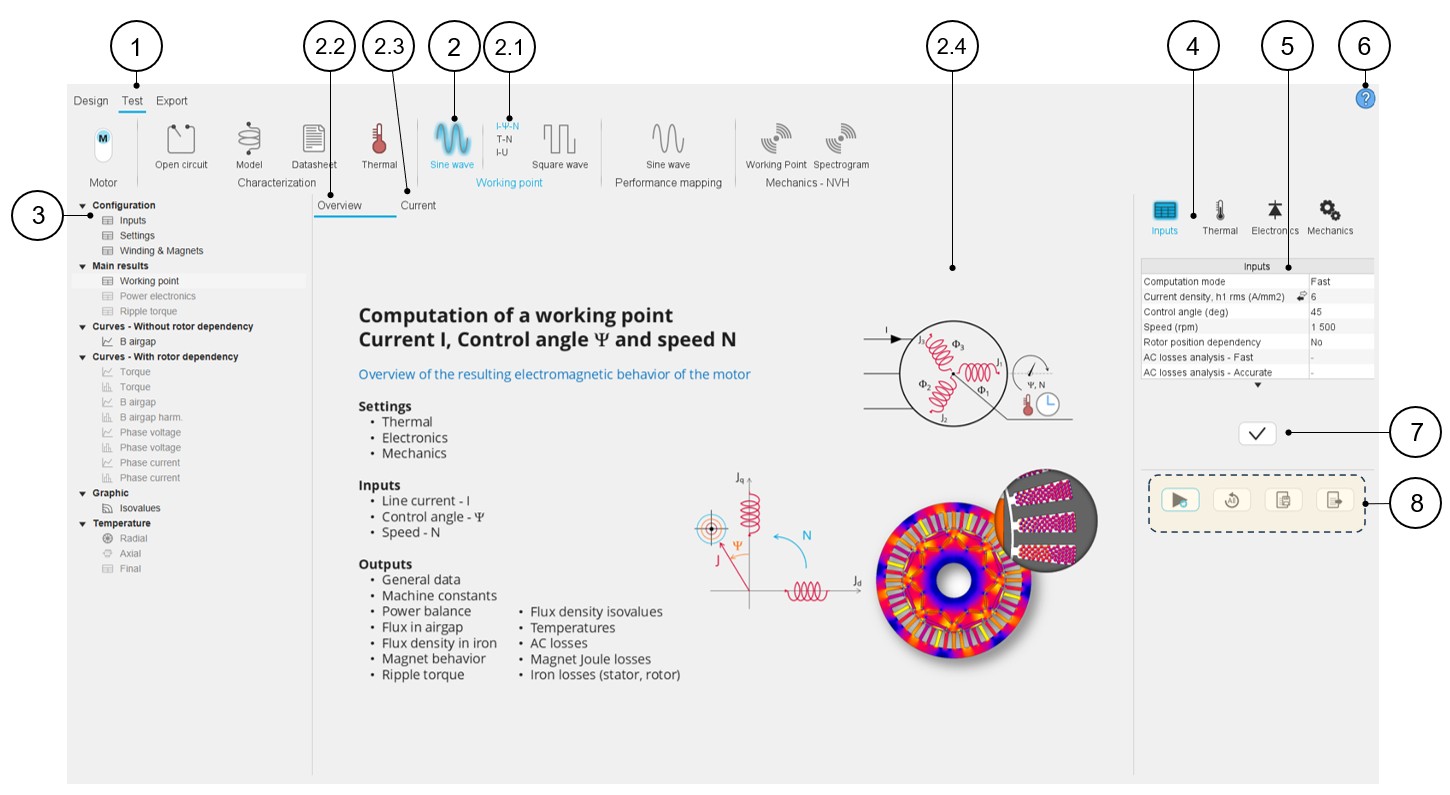
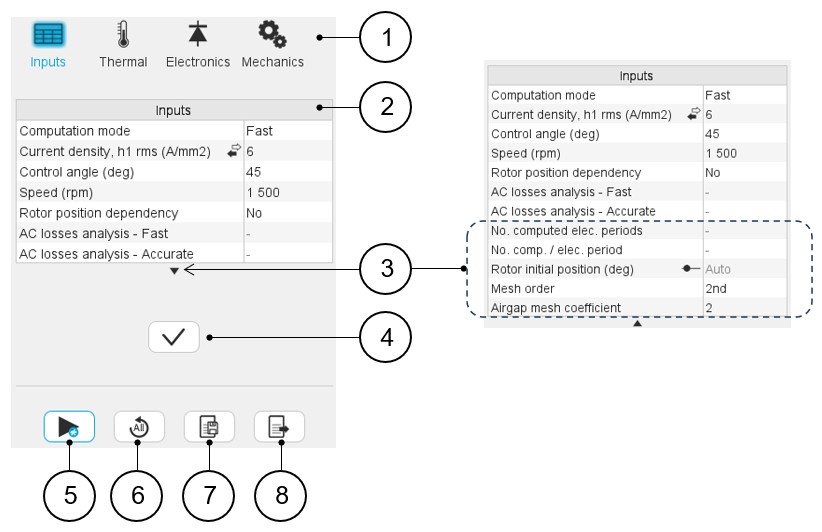
In the Motor Factory Test environment, standard tests are ready to be performed. To select and perform a test, first one must click on a test package belonging to a test family. In the example below, one selects the test package "Sine wave" of the working point test family. Among the list of available tests, one selects the computation of a working point defined by the current (I), the control angle (Ψ) and the speed (N). See the various elements of a test page below.
 |
|
|---|---|
| 1 | In Motor Factory, selection of the test environment. |
| 2 | Icon to select one test package belonging to a test family (The
test package "Sine wave" of the “Working point” test family in this
example). Note: A blue halo surrounds the
selected icon |
| 2.1 | Among the list of available tests, one selects the computation of a working point defined by the current (I), the control angle (Ψ) and the speed (N). |
| 2.2 | The default screen (Overview) allows displaying the main view, which illustrates the overview of the selected test. It gives the main entry points that give the objective, the inputs/outputs and a few illustrations of the test. |
| 2.3 | Each test has its own datasheet report. It is visible under the tab “Current”. This will be illustrated below. |
| 2.4 | Displaying the picture that illustrates the overview of the test. |
| 3 | The selection tree is where shortcuts allow access to main sections of the current test report. Clicking on a shortcut automatically focuses on the selected section inside the datasheet. |
| 4 | Scrolling selection bar where several sections can be selected to define the settings of the test. In this example four sections are available: Inputs, Thermal, Electronics and Mechanics. Once one setting section is selected, the user can define the corresponding inputs. |
| 5 | Inputs are always displayed on the right part of the screen. |
| 6 | Access to the online user help guide dedicated to the selected
test. Note: The online user help guide is
the same whatever the considered section (4) of the selected
test area (2-2.1). The user inputs and settings are all
described inside of it. |
| 7 | Button to validate the user inputs. |
| 8 | Buttons to manage the test computation and results. See the below illustrations. |
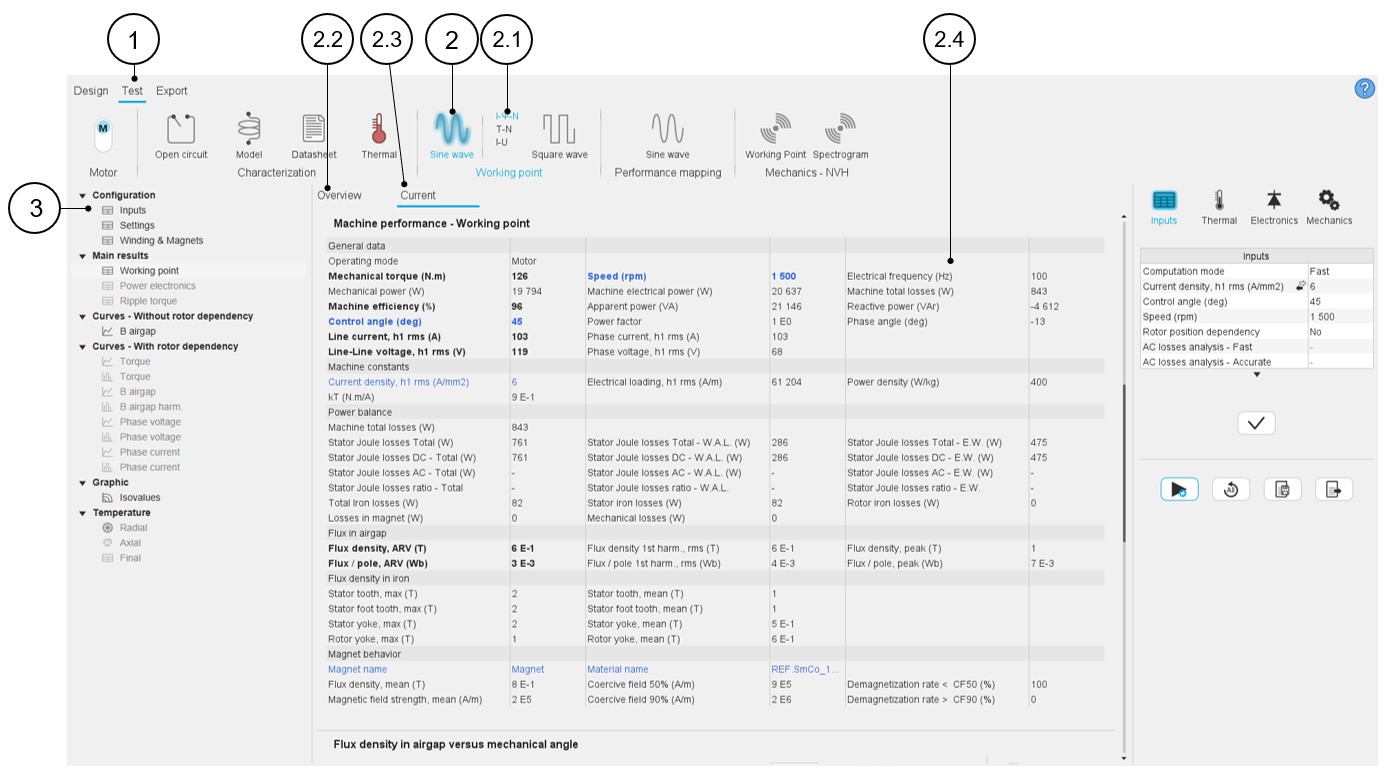
The next table described the tab “Current”. The main functions described in the previous table dedicated to the main view are also available in the “Current” view.
 |
|
|---|---|
| 1 | In Motor Factory, selection of the test environment. |
| 2 | Icon to select one test package belonging to a test family (The
test package "Sine wave" of the “Working point” test family in this
example). Note: A blue halo surrounds the
selected icon. |
| 2.1 | Among the list of available tests, one selects the computation of a working point defined by the current (I), the control angle (Ψ) and the speed (N). |
| 2.2 | The default screen (Overview) allows displaying the main view which illustrates the overview of the selected test. It gives the main entry points that give the objective, the inputs/outputs and a few illustrations of the test. |
| 2.3 | Displaying the “Current” datasheet report which gives the test
results with pictures and tables of data. In this table, data in
blue corresponds to the row of user inputs and data in black
corresponds to internal process computations. Note: This tab appears once the computation is
ended. |
| 2.4 | Displaying the “Current” datasheet report which gives the test results with pictures and tables of data. In this table, data in blue corresponds to the row of user inputs and data in black corresponds to internal process computations. |
| 3 | The selection tree is where shortcuts allow access to main sections of the current test report. Clicking on a shortcut automatically focuses on the selected section inside the datasheet. |
Management of inputs
 |
|
|---|---|
| 1 | Test settings definition. To define the general conditions
related to the machine:
Note: For more details refer to the
dedicated section “Test settings” in the user help document for
each type of machine and test. |
| 2 | User input parameters to be defined. |
| 3 | By default, only standard parameters are displayed. When needed, click on the arrow to visualize the advanced user inputs. |
| 4 | Button to apply input parameter values. |
| 5 | Button to start running the test (Input parameters are validated after clicking this button). |
| 6 | Button to restore default parameter values (Inputs as well as the settings like Thermal, Electronics and Mechanics parameters). |
| 7 | Button to save the test result. |
| 8 | Button to export test results into *.txt or *.xlsx files. |
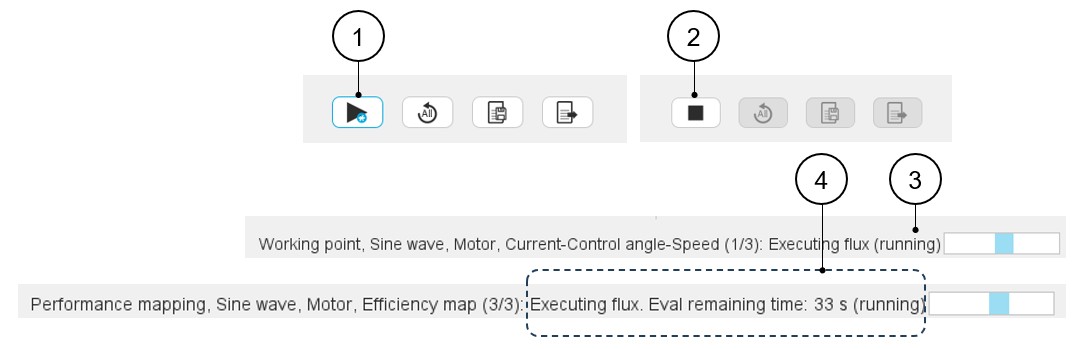
Start and Stop
Note that before running the test, even if the dedicated button to validate input parameters has not been used, FluxMotor automatically validates and records all the input parameters.
When the solving begins, the Start test button (1) turns into Stop button (2).
During the computation a progress bar appears (3). At any moment, the computation can be stopped by clicking on the Stop button (2).
 |
|
|---|---|
| 1 | The test is ready to be run. Click on the arrow to run the test. |
| 2 | The test is running, and one can stop the computation by clicking on the square shape button. |
| 3 | During the computation a progress bar appears. |
| 4 | During the computation a progress bar appears, and the remaining time for the computation is evaluated. This occurs when relevant, depending on the type of computation. |
How to save the results?
- Once a test is completed, the corresponding results can be saved by using the
Save test results button (1).
Table 6. Save test results 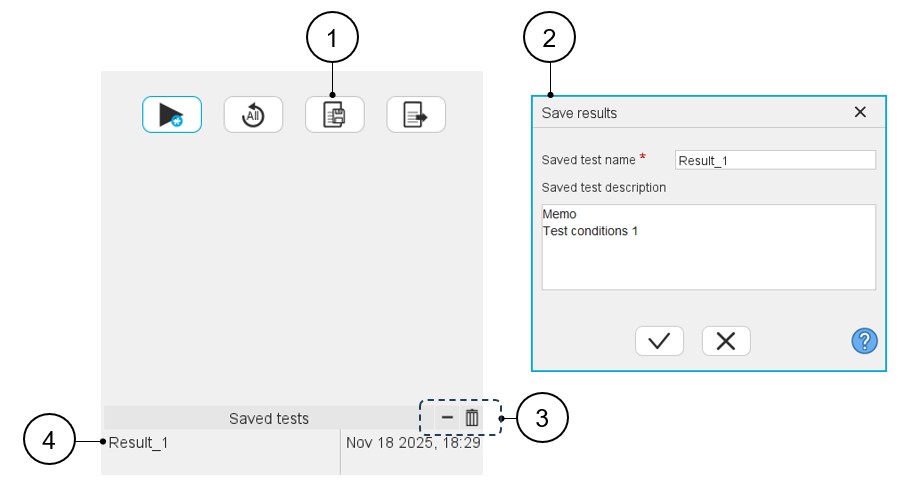
1 Button to save the test result. 2 Dialog box to save test results. Give a name and write a description. 3 By clicking on the Remove selected test (-) button, the selected saved test result is removed.By clicking on the Remove all tests (bin) button all the saved test results are removed. 4 List of the saved tests. The list of saved test results is limited to five elements. The saved results can be displayed in the test area for analysis. See below to know how to do that.
Table 7. Saved test 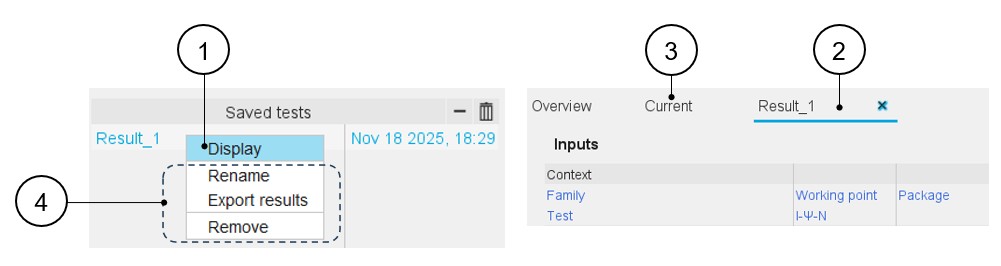
1 Click on a saved test to select it. Once the test is selected, right-click on it to open a list box that allows displaying results with the command “Display”. A double-click on the saved test result name (for example, Result_1) gives the same result.
2 The test result is displayed in a new tab inside the test results zone. 3 Displaying edited results (saved and current results) is possible by clicking on the corresponding tabs. Several saved tests can be displayed. 4 Note: Other functions available in this list box are:The selected test result can be renamed (Rename), exported (Export results - see next section) and removed (Remove).
- Management of the saved test
Table 8. Management of the saved test 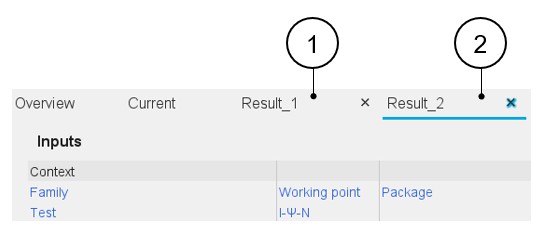
1 Several saved test results (maximum five) can be displayed inside the test area for comparison with each other. 2 X allows removing the selected test result from the test area. A test result removed from the test area can be re-displayed at any moment.
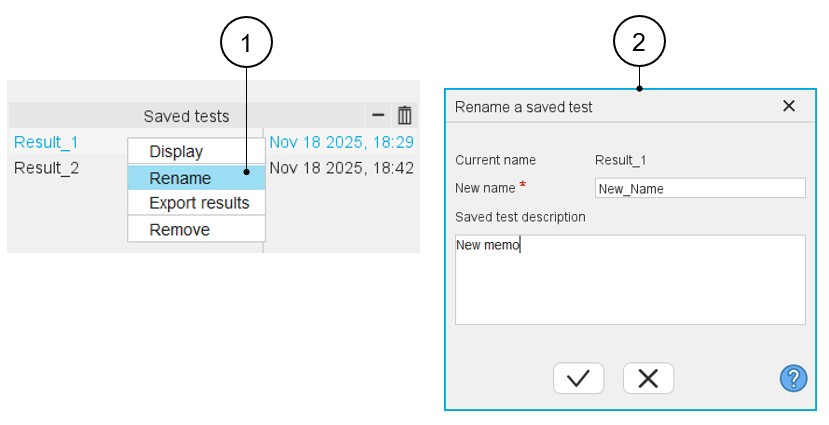
How to rename the results?
 |
|
|---|---|
| 1 | Right-click on the saved test to be renamed. |
| 2 | Dialog box to define the new saved test name with a description. |
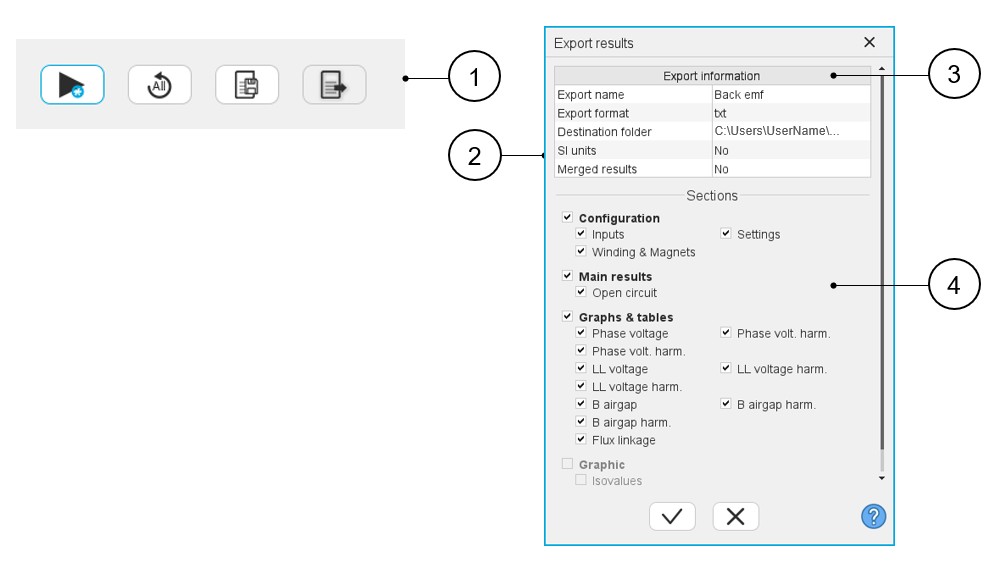
How to export the results?
When a test is completed, the corresponding results can be exported in a text file format by using the Export test results button (1).
The process of exporting results into a text file is managed inside the following dedicated dialog box.
 |
|
|---|---|
| 1 | Icon to export test results into *.txt or *.xlsx files. |
| 2 | Dialog box to export test results. See the next chapter for details about the fields in this dialog box. |
| 3 | Field to give information about the exported file:
|
| 4 | Select the results you want to export. All the results available for exporting are grouped in a section as they are in the result panel of the considered test. |