NVH - Spectrogram - T N
1. Positioning and objective
The aim of the test “ Mechanics – NVH – Spectrogram – T-N ” is to perform NVH analysis on the machine when operating at a set of targeted working points defined with the following inputs values T, N (Mechanical torque and Speed).
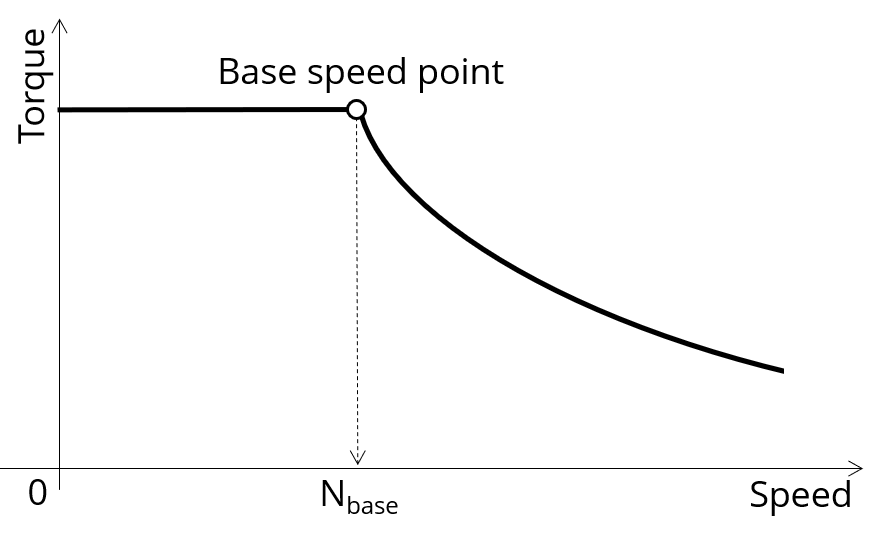 |
| Characterization of the corner point on the torque-speed curve |
Input parameters like the maximum “Line-Line voltage”, the maximum “line current” and the desired “Maximum speed” of the machine are considered.
Two types of command modes are available: The Maximum Torque Per Volt command mode (MTPV) and the Maximum Torque Per Amps command mode (MTPA).
Input parameters allow to define torque-speed envelope in the framework of which the targeted working points can be selected.
By default, the NVH evaluation is computed by considering working points on the torque-speed envelope.
But, one can define a list of working points located anywhere under (or on) the torque-speed envelope.
This test give data allowing NVH prediction in early electromagnetic and design stage.
The modal analysis of the stator mechanical structure, the radiated sound power spectrogram per engine order and versus speed and the resulting overall weighted radiated sound power versus speed are computed and displayed.
These results allow to see if there are any problem linked with NVH overall the considered speed range.
And finally, this test helps to answer the following question:
- Could the machine have any risks in connection with NVH? Yes / No.
The following table helps to classify the test “Mechanics – NVH – Spectrogram – T-N”.
| Family | Mechanics |
| Package | NVH |
| Convention | # |
| Test | Spectrogram - T- N |
| Positioning of the test “Mechanics – NVH – Spectrogram – T-N” | |
2. User inputs
A list of working points must be defined in a file. They are described with the four following input parameters:
- Selection type of working point set
- Maximum line current (or density),
- Maximum Line-Line voltage
- Command mode
- Maximum speed.
In addition, temperatures of winding must be set.
3. Main outputs
Test results are illustrated with data, graph and tables.
-
Curves to give an overview of the electromagnetic behavior of the machine versus speed
- Mechanical torque
- Power
- Line current
- Control angle
-
Graphs, curve and maps to illustrate NVH analysis results
- Modal analysis
- Radiation efficiency
- Radiated sound power spectrogram in speed-engine order area
- Radiated sound power spectrogram in speed-frequency area
- Overall weighted radiated sound power versus speed