Efficiency map - Generator
1. Positioning and objective
The aim of the test “ Performance mapping – Sine wave – Generator – Efficiency map ” is to characterize the behavior of the machine in the "Torque-Speed" area.
This test gives an overview of the electromagnetic behavior of the generator as a function of its speed.
Electrical power, mechanical torque, output voltage, electrical current, power balance, power factor and control angle are plotted versus speed.
Input parameters define the zone in which the evaluation of the machine behavior is performed.
Input parameters like the “maximum Line-Line voltage”, the “maximum line current” and the targeted “Maximum speed” of the machine are considered.
One type of command mode is available: The Maximum Torque Per Amps command mode (MTPA).
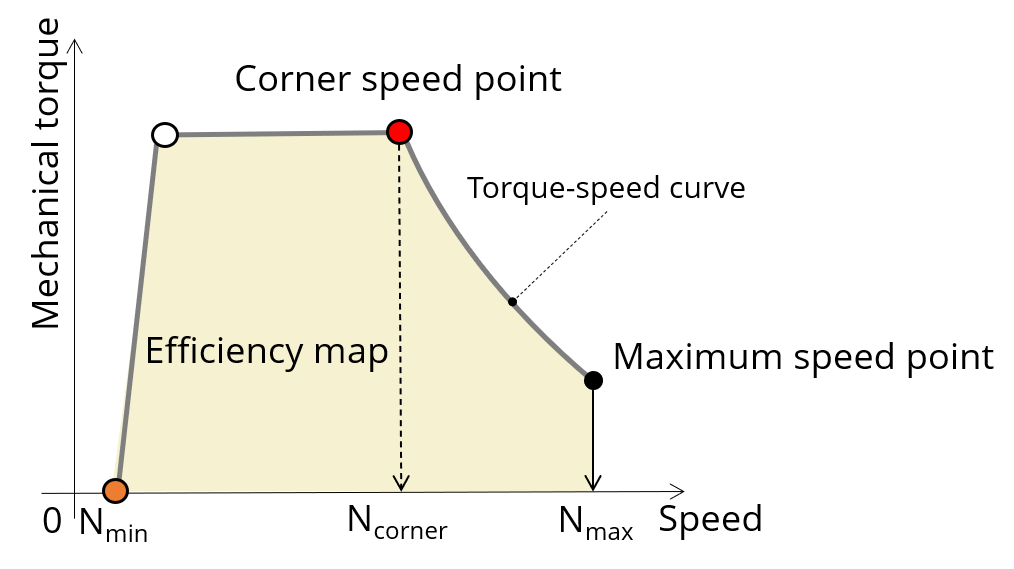 |
| Characterization of the corner speed point on the torque-speed curve |
In the results, the performance of the machine at the corner speed point for the maximum speed set by the user is presented.
A set of curves (like Torque-Speed curve) and maps (like Efficiency map) are computed and displayed.
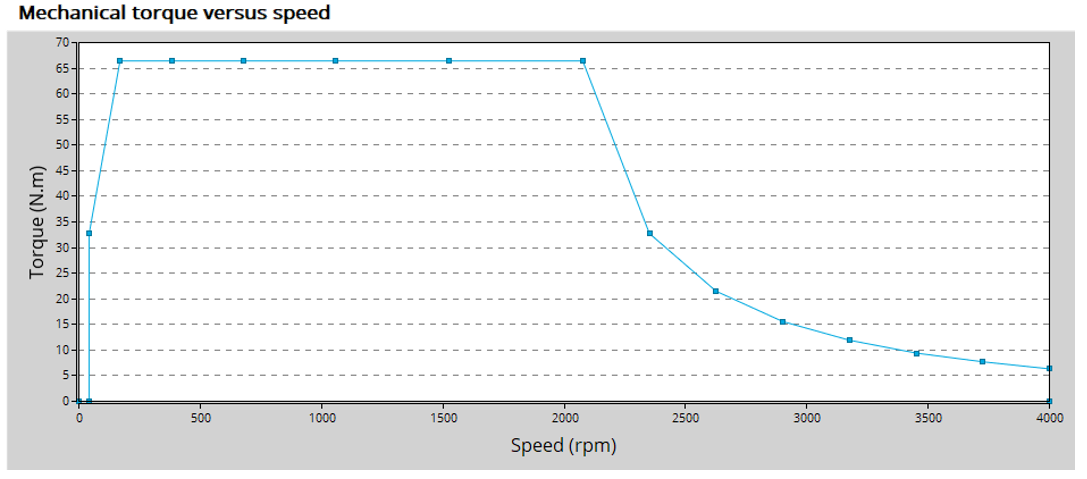 |
| Mechanical torque versus speed - Example |
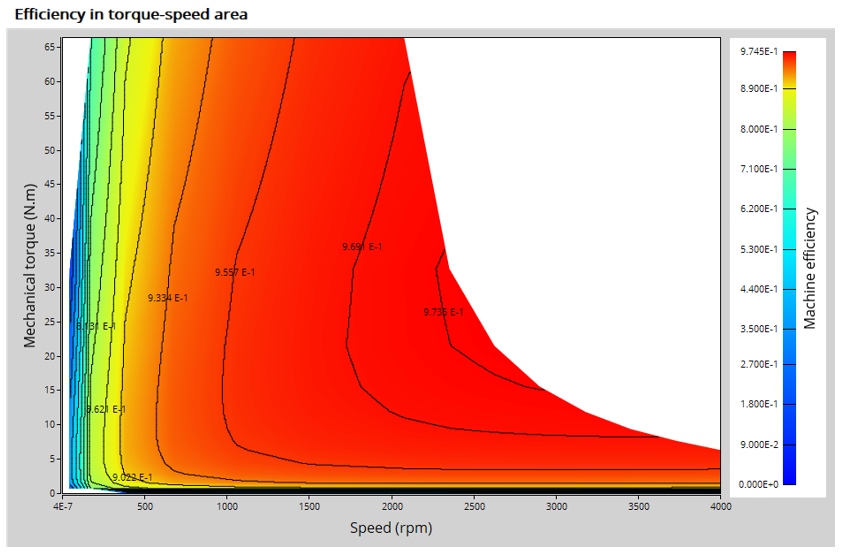 |
| Efficiency in torque-speed area - Example |
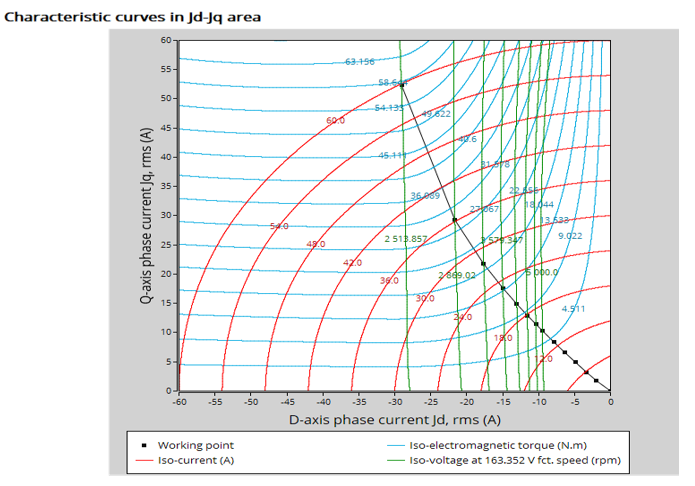 |
| Characteristics curves in J d -J q area - Example |
Moreover, two additional features are available in this test.
The first one allows extracting one point from the efficiency map to get the machine performance, for this specific working point (general data + power balance).
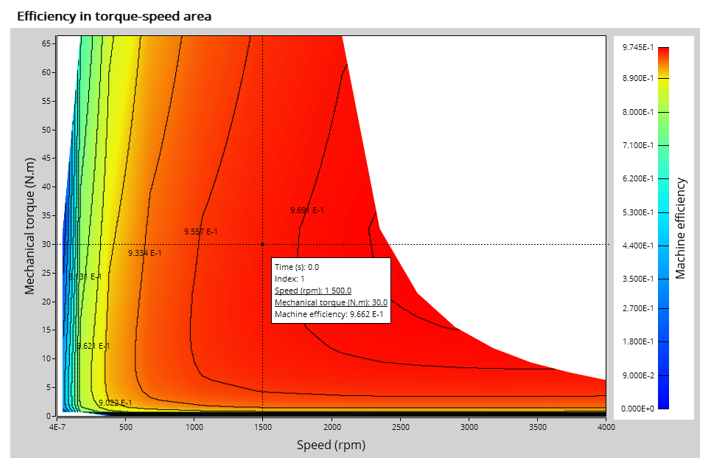 |
| A “single” working point displayed on the efficiency map - Example |
The second feature allows the user to define a duty cycle by giving a list of working points (speed, torque) versus the time. The displayed results illustrate the machine performance over the considered duty cycle (mean, min, and max values).
The time variation of the main quantities is also displayed (Mechanical torque, speed, control angle, current, voltage, power, efficiency, losses).
All the corresponding points are displayed on the provided maps.
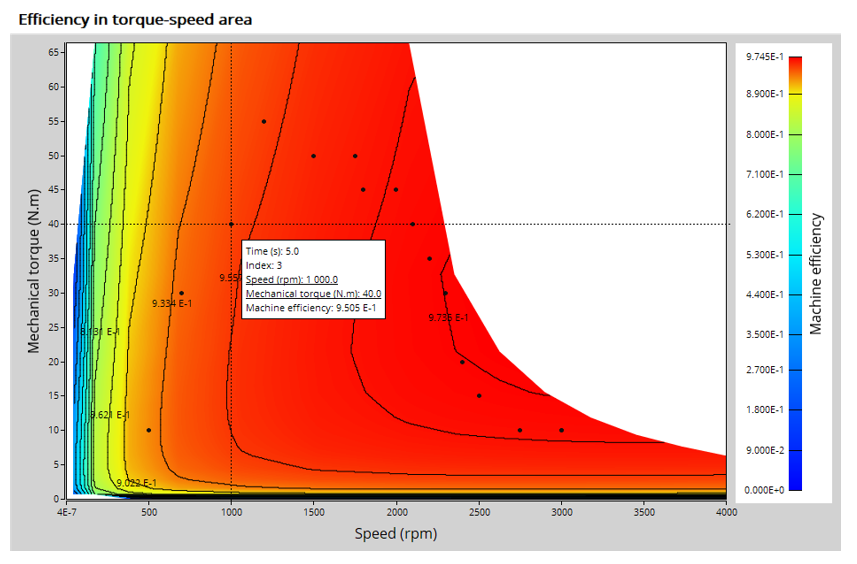 |
| A “Duty cycle” displayed on the efficiency map - Example |
The following table helps to classify the test “ Performance mapping – Sine wave – Generator – Efficiency map ”.
| Family | Performance mapping |
| Package | Sine wave |
| Convention | Generator |
| Test | Efficiency map |
| Positioning of the test “Performance mapping – Sine wave – Generator – Efficiency map” | |
2. User inputs
The main user input parameters needed to perform this test are the maximum allowed supplied Line-Line voltage, the line current, the targeted maximum speed and the command mode. Winding temperatures must also be set.
When required, the location of the working points (single or duty cycle) to be evaluated must be defined as inputs.
The three main advanced user input parameters adjusting the compromise between accuracy and computing time are: the number of computations for J d -J q , for speed and for torque.
3. Main outputs
Different kinds of outputs are displayed like data, curves, maps, and tables.
3.1 Main test results
-
Machine performance – Corner speed point
- General data
- Power balance
-
Machine performance – Maximum speed point
- General data
- Power balance
-
Machine performance – User working point (when expected)
- General data
- Power balance
-
Machine performance – Duty cycle (when expected)
- General data
- Power balance
- Energy balance
3.2 Torque-speed curves
- Torque versus speed
- Current versus speed
- Voltage versus speed
- Control angle versus speed
- Power versus speed
- Power factor versus speed
- Losses versus speed
3.3 Characteristic curves
- Electromagnetic torque versus current and control angle
- Characteristic curves in Jd-Jq area
3.4 Torque-speed maps
- Efficiency in torque-speed area
- Current in torque-speed area
- Voltage in torque-speed area
- Control angle in torque-speed area
- Power in torque-speed area
- Power factor in torque-speed area
- Losses in torque-speed area
3.5 Duty cycle curves (when expected)
- Speed versus time
- Mechanical torque versus time
- Control angle versus time
- Current versus time
- Voltage versus time
- Power factor versus time
- Power versus time
- Efficiency versus time
- Losses versus time