Model - Maps
1. Positioning and objective
The aim of the test “Characterization - Model - Motor - Maps” is to give 2D maps in J d -J q plane for characterizing the 3-Phase reluctance synchronous machines.
These maps allow predicting the behavior of the electrical rotating machine at a system level.
In this test engineers will find a system integrator and / or control-command tool adapted to their needs and able to provide accurate maps ready to be used in system simulation software like Activate.
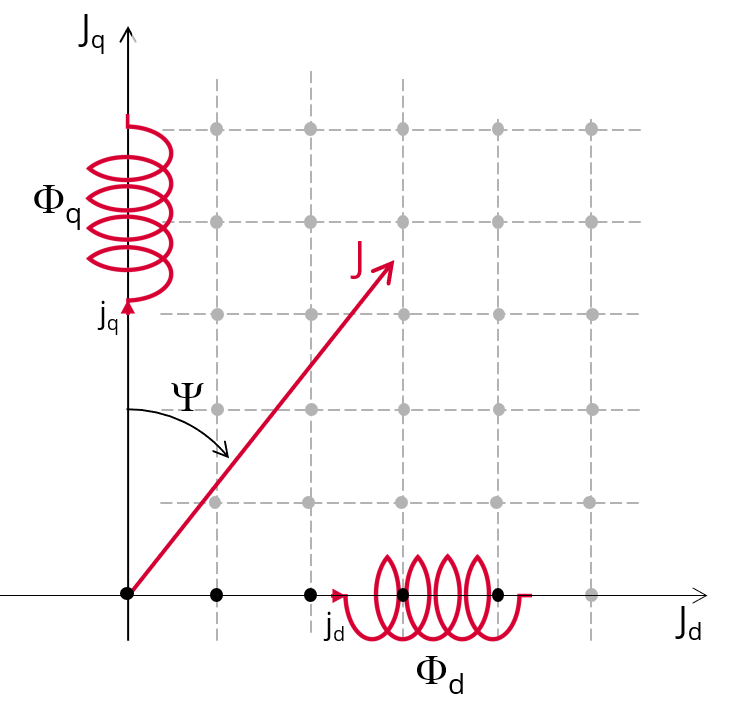 |
| “Characterization - Model - Motor - Maps” illustration |
Performance of the machine in steady state can be deduced from the results obtained in this test in association with the drive and control mode to be considered.
The following table helps to classify the test:
| Family | Characterization |
| Package | Model |
| Convention | Motor |
| Test | Maps |
| Positioning of the test “Characterization - Model - Motor - Maps” | |
2. Inputs / Outputs
2.1 User inputs
Maps are mainly function of the following user inputs: the maximum value of the electrical current, the speed and the number of quadrants to be considered and the rotor position dependency.
2.2 Main outputs
Test results are illustrated with data, graphs, and tables.
Maps in J d -J q plane
-
Flux linkage
- D-axis flux-linkage Φ d
- Q-axis flux-linkage Φ q
- Flux linkage derivative
- D-axis flux-linkage derivative with respect to the rotor position Φd/dθr in J_d-J_q area
- Q-axis flux-linkage derivative with respect to the rotor position Φq/dθr in J_d-J_q area
-
Inductance
- D-axis inductance ( dynamic, cross dynamic and static)
- Q-axis inductance ( dynamic, cross dynamic and static)
- Saliency in J d -J q area
-
Torque
- Electromagnetic torque T em
-
Losses
- Stator iron losses W iron versus speed
- Joule losses W Cus in stator winding
- Power electronics losses
- Total losses W total versus speed
Curves
- Mechanical losses versus speed