1. Introduction
Here is the process to define the gas thermal characteristics
from the importation of series of points representing the
considered quantity curve listed in an Excel file. In the following
example air mass density is considered, however the same principle
is applied for all other gas thermal quantity which are defined
below.
|
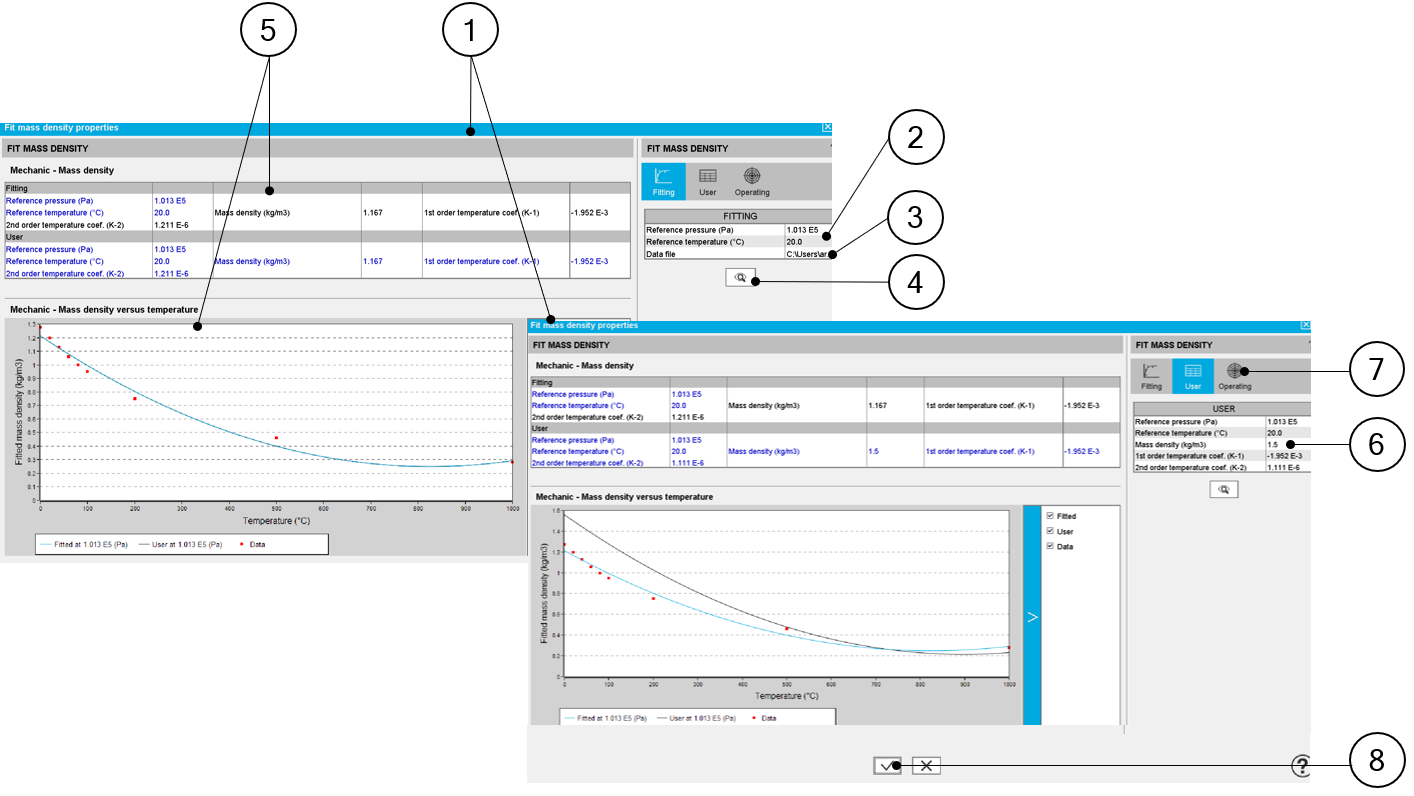
| Identification of the air mass density curve
characteristics (for instance) |
| 1 |
Dialog box allowing the characterization of the density curve imported
from an Excel file |
| 2 |
Select the reference conditions (temperature and pressure) associated
with the measures contained in the Excel file. |
| 3 |
Path where Excel file containing the measures is stored. See an example
of Excel file below. |
| 4 |
Click on this button to import the Excel data. |
| 5 |
When importing an Excel file, points representing the density curve are
listed, an optimization process automatically computes and displays the
corresponding characteristics.
Three curves are displayed:
- Red points are the imported points (listed in the Excel file)
- Blue curve is the resulting curve computed by the optimization
process. This corresponds to the computed characteristics and it is
displayed just after the computation.
- The black curve shows a new curve generated when the parameters are
changed by the user (see point 6)
|
| 6 |
Indeed, going to the tab “User” the user can adjust one or all the main
parameters of the density curve. |
| 7 |
It is possible to select an operating pressure to visualize the behavior
of the resulting mass density curve. Operating pressure should be chosen in
“Operating” tab. Note: If the chosen pressure is not
the same than the ones used for the fitting process, the measurement
points (in red) will not be displayed. |
| 8 |
Lastly the parameters, written in the input fields are validated when the
user clicks on this button.
It is possible to cancel the creation of the density curve model. In this
case, the previous values defined before opening this dialog box are
reset.
|
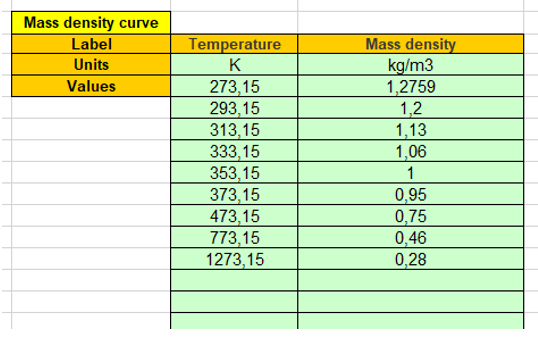
Example of an Excel file to define the mass density curve
parameters.
|
| Example of an Excel file to define the air mass density
curve parameters |
2. Mass density
|
Symbol
|
Definition
|
Unit
|
| P ref
|
Reference pressure |
Pa |
| T refD
|
Mass density reference temperature T refD
|
°C |
| r ref
|
Mass density at T refD and P ref
|
kg/m3 |
| a |
Mass density first order temperature coefficient at T refD
and P ref
|
K-1 |
| b |
Mass density second order temperature coefficient at T refD
and P ref
|
K-2 |
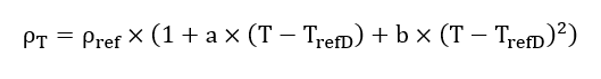
Note: The reference pressure mentioned in the previous table is also
the one considered for defining the gas specific heat.
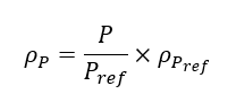
Note: For a given temperature, the gas density (kg/m 3 )
changes with the pressure following the perfect gas law.
The mass density ρ computed at a pressure P is computed as below:
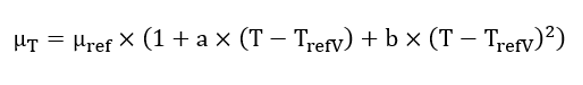
3. Dynamic viscosity
|
Symbol
|
Definition
|
Unit
|
| T refV
|
Dynamic viscosity reference temperature |
°C |
| m ref
|
Dynamic viscosity at T refV
|
kg/m/s |
| a |
Dynamic viscosity first order temperature coefficient at T
refV
|
K-1 |
| b |
Dynamic viscosity second order temperature coefficient at T
refV
|
K-2 |
Note: The model does not consider any variation of the gas dynamic
viscosity with the gas pressure.
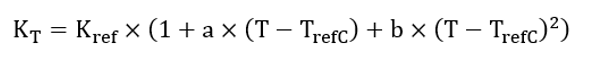
4. Thermal conductivity
|
Symbol
|
Definition
|
Unit
|
| T refC
|
Thermal conductivity reference temperature |
°C |
| K ref
|
Thermal conductivity at T refC
|
W/K/m |
| a |
Thermal conductivity first order temperature coefficient at T
refC
|
K-1 |
| b |
Thermal conductivity second order temperature coefficient at T
refC
|
K-2 |
Note: The model does not consider any variation of the gas thermal
conductivity in function with the gas pressure.
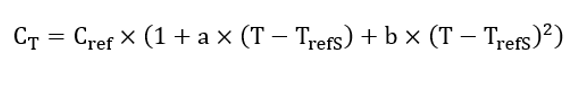
5. Specific heat
|
Symbol
|
Definition
|
Unit
|
| T refS
|
Specific heat reference temperature |
°C |
| C ref
|
Specific heat at T refS and P ref
|
J/K/Kg |
| a |
Specific heat first order temperature coefficient at T
refS and P ref (K-1) |
K-1 |
| b |
Specific heat second order temperature coefficient at T
refS and P ref (K-2) |
K-2 |
Note: All the parameters defined is the previous table are defined
for the reference pressure P ref mentioned in the gas mass density
section.
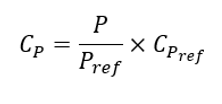
Note: For a given temperature, the gas specific heat (J/K/kg) changes
with the pressure following the perfect gas law.
he specific heat C computed at a
pressure P is computed as below:
|
Symbol
|
Definition
|
Unit
|
| P ref
|
Reference pressure |
Pa |
| C P
|
Specific heat at the pressure P |
J/K/Kg |
| C Pref
|
Specific heat at the pressure P ref
|
J/K/Kg |
6. Thermal expansion
The gas property changes with the temperature according to the
perfect gas law and is automatically applied in internal processes
with the following formula:
|
Symbol
|
Definition
|
Unit
|
| T refE
|
Temperature at which the thermal expansion must be
considered |
K |
| b T
|
Thermal expansion coefficient at the temperature T |
K-1 |