Visualization of Results
ProMan allows the visualization of the results for different time stamps.
Time-variant prediction results (field strength, power, path loss) can be opened with the tree view on the left side of the ProMan main window.
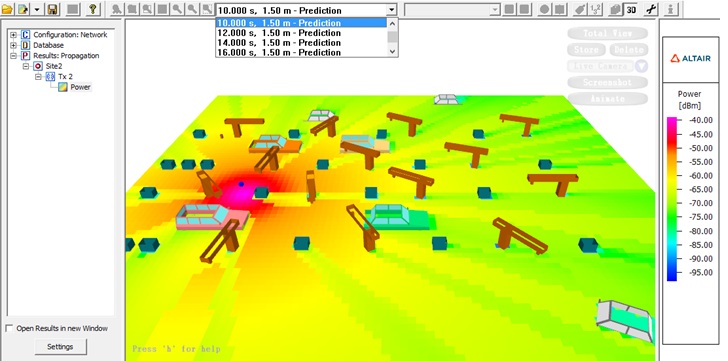
ProMan allows the visualization of the results for different time stamps.
Time-variant prediction results (field strength, power, path loss) can be opened with the tree view on the left side of the ProMan main window.