Open files containing transient analysis waveforms or eye diagrams and review the
waveforms.
You can view transient waveforms stored in different files simultaneously by opening
*.spw files one by one in the waveform viewer. Similarly,
eye diagrams stored in different files can be displayed together by opening
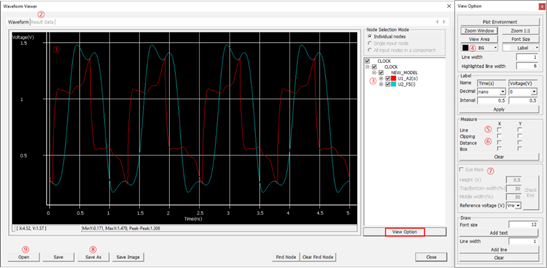
*.spe files one by one in the waveform viewer.Figure 1.
Waveform display region.
Result Data: Change the output format from graph to table data.
Toggle on and off to display certain desired waveform.
Background color can be changed.
When click X and Y, measure line will be appeared crossing the cursor, moves
the mouse to the desired position to measure and click there. Then the X and
Y values will be displayed near the clicked positions.
When both X and Y is checked at this Distance menu, the distance value
between two measured points will be displayed.
Edit the height and width of the eye mask when does the Eye Diagram
analysis. After defining the value, click Check Eye button to see the Eye
mask.
Simulated waveform can be saved with you specified name for invoking later
comparison.
Open enables display and overlapping multiple waveforms.
You can also view the measurement voltage (Vmeas), input signal (*_in), and enable
signal (*-en) of each output pin as well as static overshoot voltage high (Vmax),
static overshoot voltage low (Vmin), logic threshold voltage high (Vinh), and logic
threshold voltage low (Vinl) of each input pin. For differential nets, you can view
the waveforms of voltage differences (Vdiff) between the differential input node
pairs by selecting them which are shown under the positive input nodes. Selecting or
unselecting an input node for waveform display makes the differential pair node be
automatically selected or unselected. Many displays and measuring options are
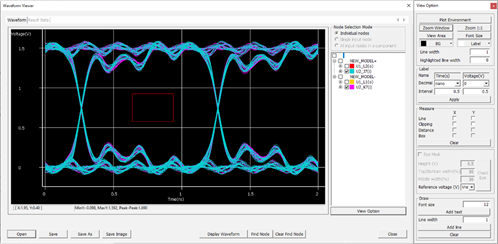
available in the waveform viewer.Figure 2.
The analysis results can be listed in a table form by clicking Result
Data tab. They can be also shown in MS Excel. The waveform data can
be saved in a file with the use of Save or Save As menu. Save menu saves the file in
Signal_Integrity/Waveform directory under the PCB design
job folder. The model name plus .spw is used for the file name.
The saved waveform data can be read into the waveform viewer alone or together with
other waveform data for a review or comparison.