Tutorial: Setting Up a Fluid Flow Simulation
Tutorial Level: Beginner Set up and run a fluids analysis.
Inspire Fluids supports internal flow and thermal-related simulations. In this tutorial, you will learn how to:
- Import geometry
- Designate fluid domains
- Set up inlets and outlets
- Set up solver settings
- View run status and plots
- Post-process results
Import Geometry
- From the menu bar, select .
-
Browse to your working directory, select
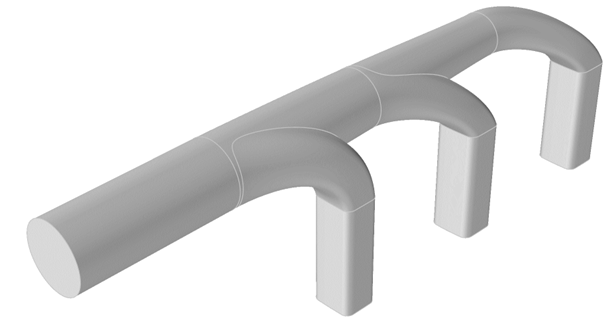
Fluids_ExhaustManifold.x_t, and click
Open.
The model opens in the modeling window.
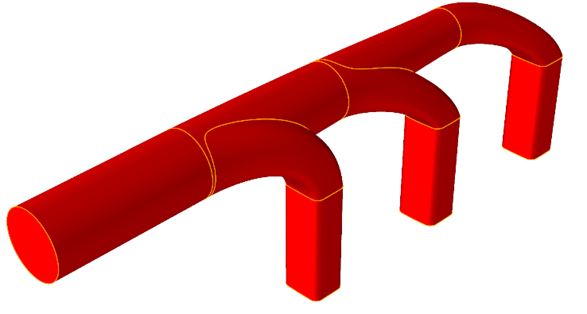
Designate the Fluid Domain
-
Click the Designate Fluid Domain icon.
 Tip: To find and open a tool, press Ctrl+F. For more information, see Find and Search for Tools.
 -
Select the part.
The fluid domain is automatically detected and turns red.
-
Choose a fluid from the dropdown microdialog.
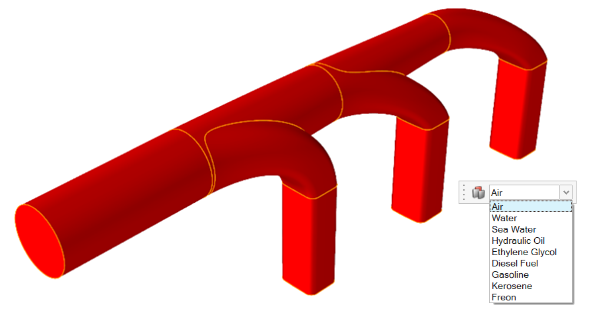
- Right-click and mouse through the check mark to exit, or double-right-click.
Set Up Inlets
- Click the Inlet icon.

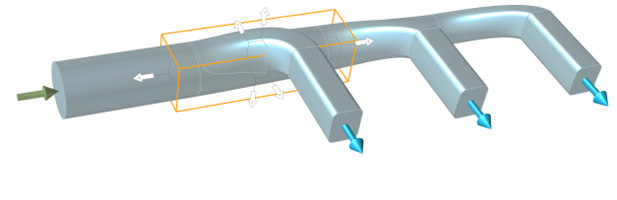
- Select a face in the model where you would like to define an inlet. An arrow
appears at each defined inlet.
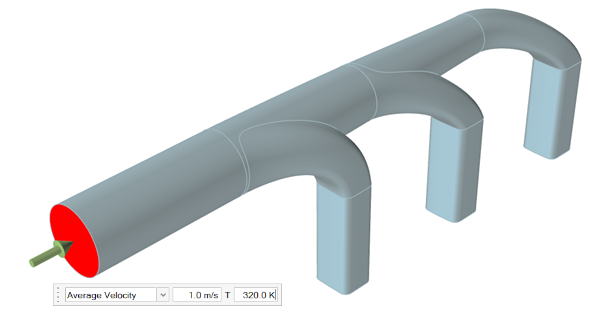
- In the microdialog, enter 1 m/s for the Average Velocity and 320K for the temperature.
- Right-click and mouse through the check mark to exit, or double-right-click.
Set Up Outlets
- Click the Outlet icon.

- Select a face in the model where you would like to define an outlet.
An arrow appears at each defined outlet.
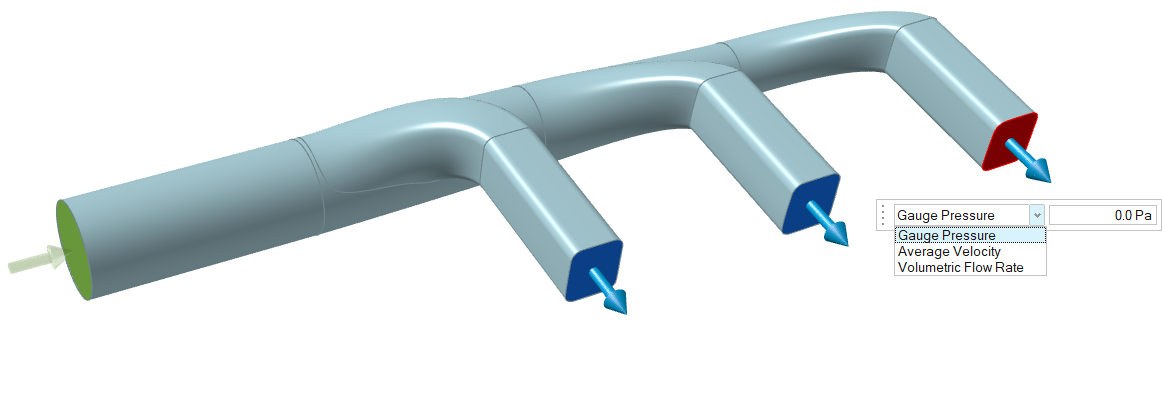 Note: By default, all unassigned surfaces are considered walls.
 - Right-click and mouse through the check mark to exit, or double-right-click.
Set Up Solver Settings
- Click the Custom Fluids Run icon.
- Select the Simulation tab.
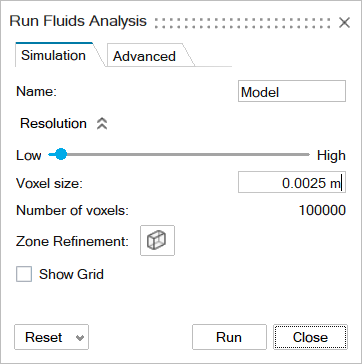
- Enter a Name for the simulation.
- Set the Resolution to Low.
- Set the Voxel size to 0.0025m.
- Set the Number of voxels to 100000.
- Click the Zone Refinement icon, then use the white arrows
to adjust the refinement box to specify critical regions of the flow geometry
for the analysis.
- Optional: Turn on Show Grid to visualize the grid spacing around the geometry.
- Select the Advanced tab.
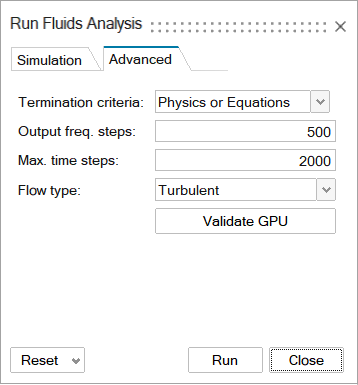
- Set the Termination criteria to Physics or Equations.
- Set the Output freq. steps to 500.
- Set the Max. time steps to 2000.
- Set the Flow type to Turbulent.
- Click Run to start the simulation.
- Once the simulation is complete, a green flag will appear on the Show
Fluids Results icon.

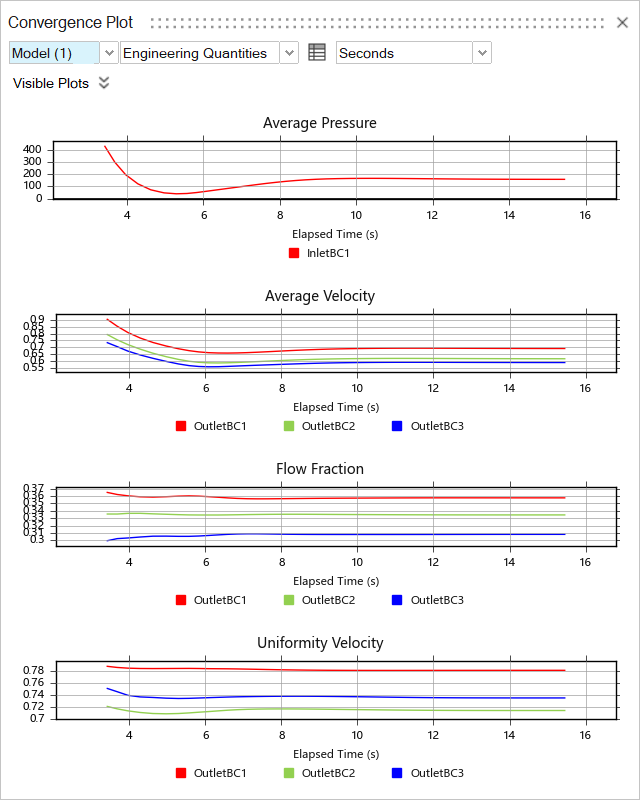
View Run Status and Plots
- Click the View Convergence Plot satellite icon to view
the plots from your analysis.

 Note: If you click the Show Convergence Table icon
 , the data in the Convergence
Plot window will display as a table in the modeling
window.
, the data in the Convergence
Plot window will display as a table in the modeling
window.
- In the Run Status window, double-click the project.
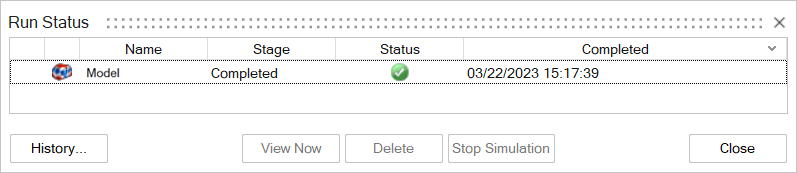
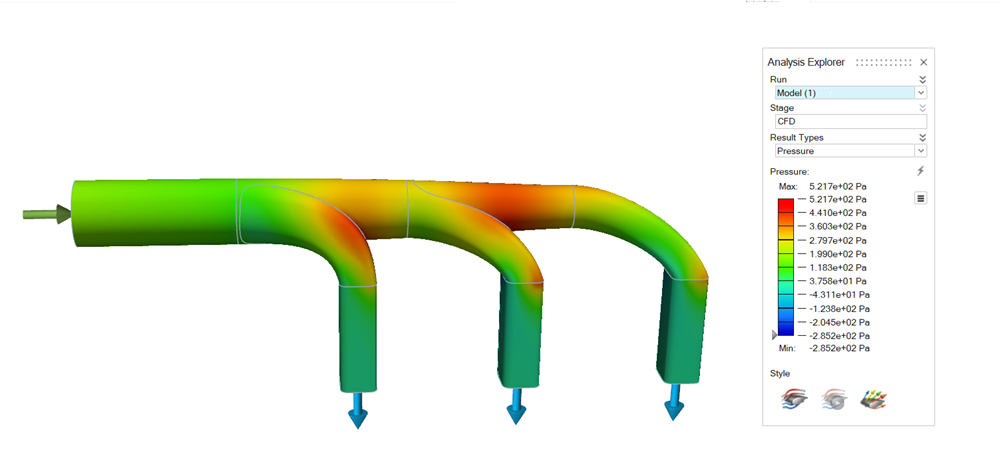
The Analysis Explorer appears, and the modeling window displays the results.
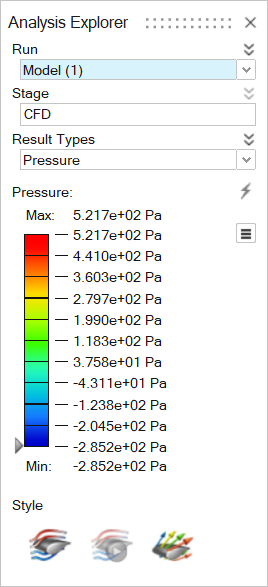
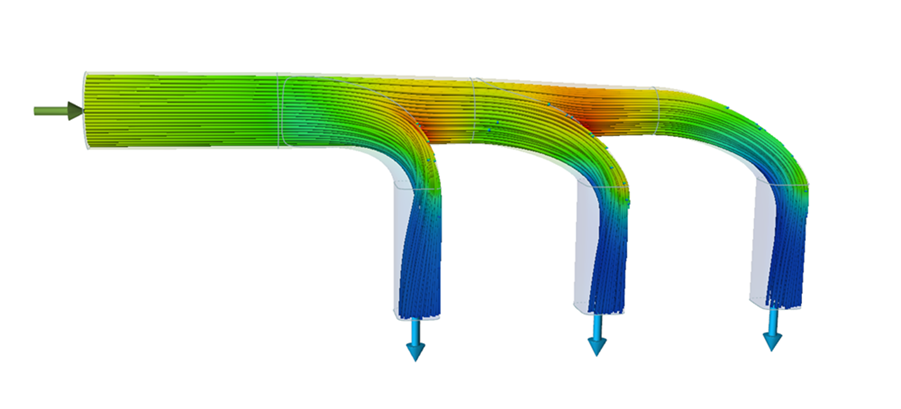
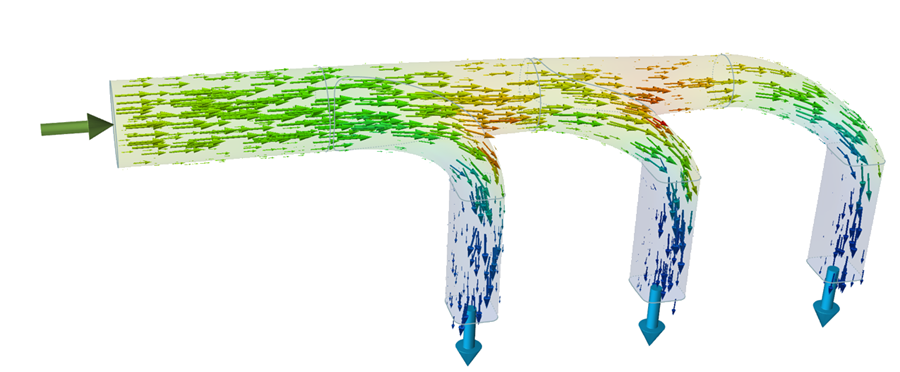
Post-Processing
The Analysis Explorer shows contours of flow parameters, streamlines, animations, and vectors for your analysis results.