Nodes/Tasker Table
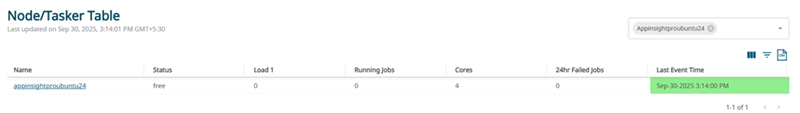
The Node/Tasker Table shows node status, system load, current running job, failed jobs in each node.
The following metrics provide node-level insights, monitoring node status and analyzing
jobs requested and usage. You can also select more attributes by clicking the ![]() icon. For more
details on how to select node attributes, see Customize the Summary Table in the Report.
icon. For more
details on how to select node attributes, see Customize the Summary Table in the Report.
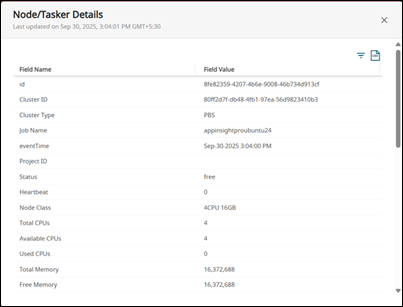
- Name: The name of the node or tasker. You can open the details of each node
or tasker by clicking the link.
- Status: Indicates the tasker’s operational state.
- Load 1: The 1-minute average system load, useful for evaluating immediate computational demand on the node.
- Running Jobs: The number of jobs currently being executed on that tasker.
- Cores: Total number of logical cores available on the node for job execution.
- 24hr Failed Jobs: Number of job failures reported on that node/tasker in the last 24 hours, useful for identifying problematic nodes.
- Last Event Time: Timestamp of the most recent event or update involving the
node or tasker.
This column shows how recently updates were applied to the job, using the following color indicators:
 Green: Last event occurred less than 10
minutes ago
Green: Last event occurred less than 10
minutes ago Orange: Last event occurred between 10
and 30 minutes ago
Orange: Last event occurred between 10
and 30 minutes ago Red: Last event occurred more than 30 minutes ago