Cluster Dashboard
The Cluster dashboard provides a comprehensive overview of job activity, node utilization, and system performance within the HPC environment.
Additionally, the dashboard includes insights into node performance, including average utilization, uptime percentage, and the number of nodes that are currently down. It further provides reports on overall resource utilization (including CPU cores, memory, and GPUs) and aggregates data across multiple clusters when applicable. Users can also access reports on job queue states and waiting times to optimize workload distribution and system efficiency.
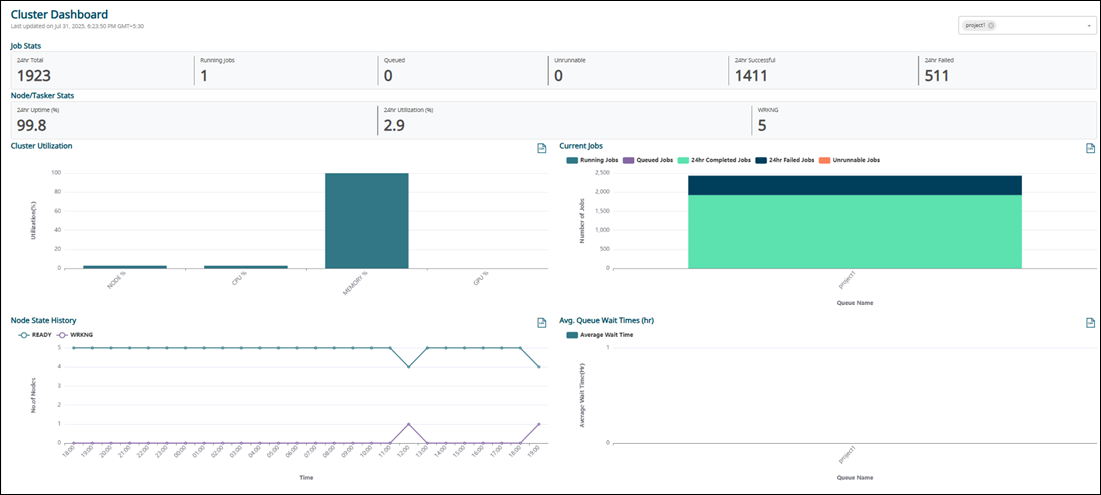
Job Stats
- 24hr Total Jobs: The total number of jobs that have been queued, executed, or completed in the past 24 hours.
- Running Jobs: The current total number of active running jobs.
- Queued Jobs: The current total number of jobs in the queue.
- Unrunnable Jobs: The total number of jobs currently in the queue but marked as unable to run.
- 24hr Successful Jobs: The total number of jobs that successfully completed without exit code errors in the past 24 hours.
- 24hr Failed Jobs: The total number of jobs that failed due to an exit code error in the past 24 hours.
For example, you can view only running jobs in the Job Table.
- 24hr Node Utilization (%): The average percentage node utilization over the last 24 hours
- 24hr Node Uptime (%): The percentage of node-hours in the environment that were operational, with values below 100% indicating downtime on at least one node.
- Down Nodes: The current number of nodes recognized as down by the WLM.
For example, you can view only running nodes in the Node/Tasker Table.
Cluster Utilization Report
The Cluster Utilization report displays the overall utilization percentage of the HPC environment, categorized by resources such as nodes, CPU cores, memory, and GPUs. If multiple clusters are registered with InsightPro, the data is presented as a consolidated view across all clusters.
Node State History Report
Current Jobs Report
The Current Jobs report provides a breakdown of the number of jobs in each queue, categorized by job state.
Avg. Queue Wait Times (hr) Report
The Avg. Queue Wait Times (hr) report provides a breakdown of the average wait time for jobs in the queue over the past 24 hours, categorized by queue.