Jobs Dashboard
The jobs dashboard provides a comprehensive view of job activity and system performance within the HPC environment.
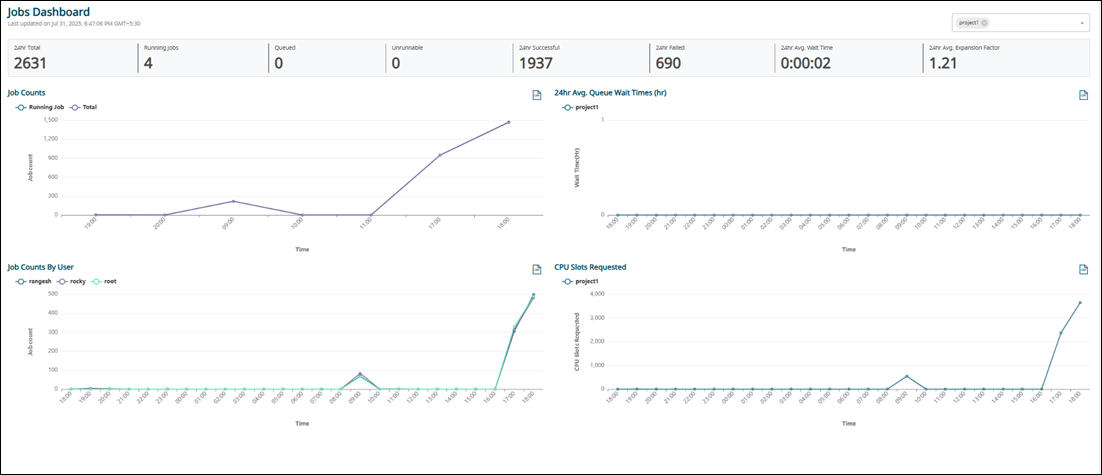
- 24hr Total Jobs: The total count of jobs that were queued, running, or completed within the past 24 hours.
- Running Jobs: The current total of actively running jobs.
- Queued Jobs: The current total of jobs waiting in the queue.
- Unrunnable Jobs: The total number of jobs currently in the queue but marked as unable to run.
- 24hr Successful Jobs: The total number of jobs that finished successfully without any exit code errors in the last 24 hours.
- 24hr Failed Jobs: The total number of jobs that encountered an exit code error and failed in the last 24 hours.
- 24hr Avg. Wait Time: The average duration jobs remained in the queue before execution over the past 24 hours.
- 24hr Avg. Expansion Factor: The average Expansion Factor of completed jobs in the last 24 hours, calculated as (Queued Time + Run Time) / Run Time.
To view the list of jobs filtered by a specific type of job, right-click on a specific attribute and click Show Jobs. The Job Table displays the specific type of jobs.
Job Counts Report
The Job Counts report provides a historical view of the number of jobs in the system, categorized by state (Running, Queued, and so on).
Job Counts By User Report
The Job Counts By User report presents a historical overview of the number of jobs in the system, categorized by user, displaying only the top users.
24hr Avg. Queue Wait Times (hr) Report
The 24hr Avg. Queue Wait Times (hr) report provides a historical view of the 24-hour rolling average queue wait times, representing the average duration jobs spent in a queued state before execution.
CPU Slots Requested Report
The CPU Slots Requested report monitors the total number of cores requested for jobs in each queue, providing insight into the workload distribution at any given moment.