
OS-V: 0430 Cantilevered Thin Square Plate
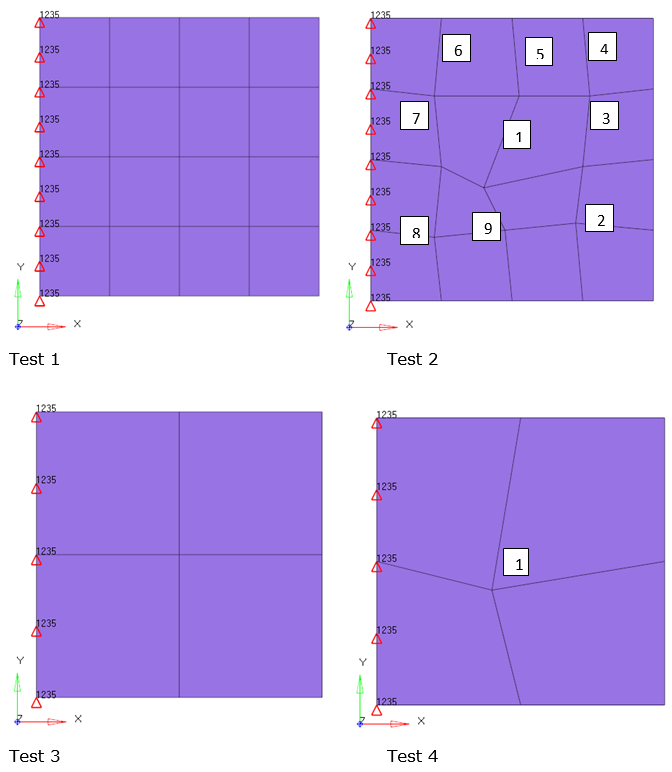
Test No. FV16 A cantilevered thin square plate of 10 m × 10 m dimension. OptiStruct is used to investigate the frequencies at different modes for different test cases.
| Node No. | Coordinates(m) | |
|---|---|---|
| x | y | |
| 1 | 4.0 | 4.0 |
| 2 | 2.25 | 2.25 |
| 3 | 4.75 | 2.5 |
| 4 | 7.25 | 2.75 |
| 5 | 7.5 | 4.75 |
| 6 | 7.75 | 7.25 |
| 7 | 5.25 | 7.25 |
| 8 | 2.25 | 7.25 |
| 9 | 2.5 | 4.75 |
| Node No. | Coordinates(m) | |
|---|---|---|
| x | y | |
| 1 | 4.0 | 4.0 |
Model Files
Before you begin, copy the file(s) used in this problem
to your working directory.
Benchmark Model
Quad8 elements are used to model different test cases with specific grid point locations. The thickness of the plate is 0.05 m. The x, y, z displacements and y rotations are zero along y-axis.
The material properties are:
- Property
- Value
- Young's Modulus
- 200 x 109 N/m2
- Poisson's Ratio
- 0.3
- Density
- 8000 kg/m3
Modal Analysis Results
The frequency of each targeted mode is normalized with the NAFEMS closed form
solution.
| Frequencies (Hz) | Mode 1 | Mode 2 | Mode 3 | Mode 4 | Mode 5 | Mode 6 |
|---|---|---|---|---|---|---|
| Reference Solution | 0.421 | 1.029 | 2.582 | 3.306 | 3.753 | 6.555 |
| Test 1 | 0.41 | 0.99 | 2.33 | 3.0 | 3.44 | 5.82 |
| Normalized | 1.026829 | 1.041498 | 1.109107 | 1.100899 | 1.090671 | 1.125708 |
| Test 2 | 0.41 | 0.99 | 2.34 | 3 | 3.44 | 5.83 |
| Normalized | 1.026829 | 1.042553 | 1.103891 | 1.103103 | 1.091306 | 1.125129 |
| Test 3 | 0.39 | 0.92 | 1.84 | 2.47 | 2.93 | 3.57 |
| Normalized | 1.085052 | 1.117264 | 1.403261 | 1.33792 | 1.280887 | 1.83871 |
| Test 4 | 0.39 | 0.91 | 1.86 | 2.44 | 2.82 | 3.25 |
| Normalized | 1.087855 | 1.130769 | 1.391164 | 1.355474 | 1.333215 | 2.015063 |
Reference
NAFEMS R0015 - Selected benchmarks for natural frequency analysis